A Competitive Matrix Analysis That Actually Works
Ditch the giant spreadsheets. Learn how to build a competitive matrix analysis that gives you a real edge. A simple guide for startups to win more.

Let's be real, 'competitive matrix analysis' sounds like something cooked up in a stuffy boardroom. But it’s just a fancy name for a simple chart that shows you where you stand against your rivals. No MBA required.
It’s about turning those gut feelings and "I think we're better" moments into an actual game plan. This isn't about building a monster spreadsheet nobody looks at; it’s about creating a clear map that reveals your secret superpower.
What Is a Competitive Matrix Analysis Anyway?
Think of it as your secret weapon. A competitive matrix shows you exactly where to attack, where to defend your turf, and frankly, where to just let your competitors flail around. It's the business equivalent of knowing the other team's playbook.
This process is way more than just a feature-for-feature checklist. It’s a strategic tool that helps you spot huge opportunities in the market and stops you from getting distracted by shiny new features nobody actually wants.
Turning Feelings into Facts
The real magic happens when you move beyond vague ideas and start putting some numbers behind your assumptions. A popular way to do this is with a Competitive Profile Matrix (CPM). Here, you don't just list features; you assign a "weight" to each one based on how much it actually matters to your customers.
There's a reason the big players do this. A McKinsey survey found that 78% of Fortune 500 firms use some form of CPM in their reviews, and doing so boosts their strategic decision accuracy by an impressive 35%. It’s about turning hunches into evidence-based moves.
Here’s a quick look at what a basic matrix might look like.

You can see that "Company 1" comes out on top. Not because it wins on every single feature, but because it scores well on the things that matter most—the heavily weighted factors like market share and product quality. You can learn more about how to turn competitor data into a winning strategy.
Tools like Ahrefs or Semrush are great for digging up some of this data, but they can be expensive. For a more direct and automated way to gather this kind of intel, platforms like already.dev offer a much smarter alternative.
Choosing Your Rivals and What to Measure
A competitive matrix is only as good as what you put into it. Garbage in, garbage out, as they say. So, let's nail down the two most critical pieces of the puzzle: picking the right competitors and deciding which features actually matter.
It's easy to fall into the trap of listing every single company that even smells like a competitor. Don't do it. A long, cluttered list just creates noise and paralyzes you with too much information. Instead, you need to focus on the real threats—the companies your sales team keeps losing deals to and the hungry upstarts that are starting to pop up everywhere.
Who Are You Actually Fighting With?
Think of your competitors in a few distinct buckets. You’ve got your direct rivals, the ones offering a nearly identical product to the same customers. Then there are the indirect competitors who solve the same core problem but with a completely different solution. And never, ever forget the emerging threats—those new kids on the block who could eat your lunch tomorrow.
Getting this landscape right is fundamental. If you're struggling to map it all out, our guide on https://blog.already.dev/posts/how-to-find-competitors can walk you through a more structured process.
> Pro Tip: Your sales team's call recordings are a goldmine. The competitor names that come up over and over again are your real competition, straight from your customers' mouths.
Once you’ve narrowed it down to a tight list of 3-5 key rivals, it's time to figure out what you're actually going to compare. This isn't about creating a laundry list of 50 features. It’s about zeroing in on the 5-10 things that truly make a customer choose one product over another.
Finding Your "Key Success Factors"
These are the criteria that define your battlefield. They're what customers actually care about. Forget the cool tech your engineers are proud of; we're focused on what solves a real, painful problem for the user.
So, where do you find these factors? You have to do some digging.
- Scour customer reviews: Read through what people are praising (and complaining about) on sites like G2 and Capterra. Look for the patterns.
- Dissect competitor ads: What benefits are they shouting from the rooftops? That’s what they think their customers want to hear.
- Analyze sales data: Seeing who the key players are is crucial. A good review of the top B2B sales prospecting tools can show you how different solutions are positioned and which features they lean on heavily.
You're looking for tangible, comparable attributes. Instead of something vague like "Good UI," get specific with something like "Onboarding Simplicity" or "Time to First 'Aha!' Moment." Other great examples are "Pricing Flexibility," "Integration Ecosystem," and "Customer Support Quality." These are the metrics that will give your analysis some real strategic teeth.
You can definitely gather this data by hand, or you could use SEO tools like Ahrefs or Semrush, but be warned, they can be expensive. For a more automated and focused approach, a platform like already.dev can surface these critical insights for you quickly.
Building Your Matrix and Scoring Honestly
Alright, let's get down to business and actually build this thing. Forget about fancy, over-engineered spreadsheets for a minute—a simple grid is all you need to get started. The real magic isn't the tool you use; it's how you score.
This is where weighting comes in. Not all features carry the same weight in a customer's mind, right? A beautiful UI is nice, but for a project management tool, seamless integrations might be the absolute deal-breaker. You need to assign a 'weight' to each factor you identified earlier, reflecting what your customers value most. A simple way to do this is to make all your weights add up to 1.0 (or 100%).
Assigning Weights That Matter
Let’s stick with our project management tool example. Imagine your key success factors are “Ease of Use,” “Integration Options,” and “Pricing.” After sifting through G2 reviews and listening to sales call recordings, you realize that people are constantly complaining about clunky, complex tools.
That insight tells you how to weigh your factors:
- Ease of Use: 0.5 (This is clearly the biggest pain point and decision-driver)
- Integration Options: 0.3 (Important for workflow, but secondary to usability)
- Pricing: 0.2 (People will pay for a tool that solves their biggest headache)
This process forces you to be disciplined and focus on what genuinely influences a purchase, not just on the features you think are cool.
Now for the scoring. This is where you have to be brutally honest. Rate everyone (including yourself) on a scale of 1 to 5 for each factor. Is your customer support really a flawless ‘5,’ or is it more of a ‘3’ on a good day? If you need a hand with the structure, you can always find inspiration from a competitor analysis template free to get started.
This diagram helps you think about who you should be scoring in the first place.
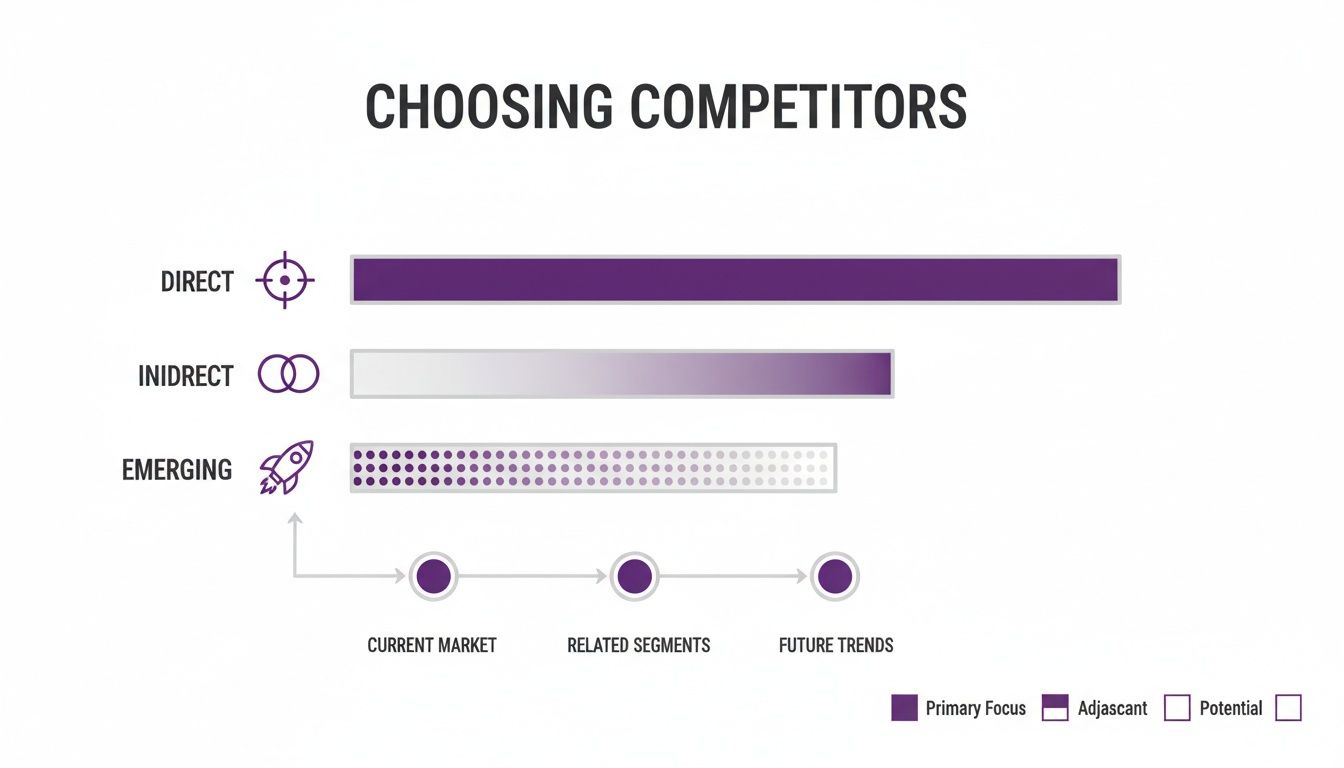
It’s crucial to look beyond just your direct rivals. Indirect and emerging players can often reveal where the market is headed.
Keeping Your Scoring Objective
Let's be real: scoring yourself is tough. We all have that founder bias and think our product is perfect. The best way to fight this is to ground every single score in hard evidence.
> Don't just pull numbers out of thin air. For "Customer Support," check your actual ticket response times or NPS scores. For "Pricing," do a line-by-line comparison of your plans versus theirs. The more data you bring in, the more trustworthy your competitive matrix analysis will be.
Once your scores are in, the math is simple. Just multiply each score by its assigned weight. So, if your "Ease of Use" score is a 4, its weighted score is 4 x 0.5 = 2.0. Do this for every factor, for every company in your matrix.
The final step is to add up the weighted scores for each company. Suddenly, you have a single, powerful number that paints a clear picture of the competitive landscape.
Example Competitive Matrix For a Project Management Tool
To make this tangible, here’s a simplified, weighted matrix comparing a few fictional project management tools. Notice how the final scores aren't just about who has the most features, but who performs best on the features that matter most to customers.
| Feature/Factor | Weight | Our Product (Score) | Competitor A (Score) | Competitor B (Score) | | :--- | :--- | :--- | :--- | :--- | | Ease of Use | 0.5 | 4 (Weighted: 2.0) | 3 (Weighted: 1.5) | 5 (Weighted: 2.5) | | Integration Options | 0.3 | 5 (Weighted: 1.5) | 5 (Weighted: 1.5) | 2 (Weighted: 0.6) | | Pricing | 0.2 | 3 (Weighted: 0.6) | 4 (Weighted: 0.8) | 3 (Weighted: 0.6) | | Total Score | 1.0 | 4.1 | 3.8 | 3.7 |
As you can see, even though Competitor B has the best "Ease of Use," its poor integrations pull its total score down. Our product comes out on top by being strong in the two most heavily weighted categories. This isn't just a list of features anymore; it’s a quantified, strategic view of your position in the market.
Turning Your Matrix Into a Strategy
Alright, you've done the hard work. The grid is filled out, the scores are in, and you've got a comprehensive map of your competitive landscape staring back at you. It looks impressive, but let's be honest—a finished matrix is just a static spreadsheet. The real value is in the story it tells.
This is where you put on your detective hat. We're about to transform that grid of data into an action plan that gives your teams clear direction. You're hunting for the story hidden between the rows and columns.
Find the Gaps and Patterns
First things first, scan for the outliers. Where are you absolutely blowing the competition out of the water? That's marketing gold. Your team needs to be shouting about that from the rooftops.
Now, look at the other end of the spectrum. Where are you getting crushed? That’s a five-alarm fire for your product team or a clear signal to your sales reps about which features to de-emphasize in demos.
Then, zoom out and look for industry-wide trends. What if everyone—including you—scored poorly on a feature like "Mobile Experience"? Bingo. You've just stumbled upon a massive market gap, a wide-open opportunity for whoever decides to own it first.
> The goal here isn't just to see where you stand, but to see the shape of the entire battlefield. The data will show you the hills you should capture and the swamps you should avoid.
This whole process is the essence of competitive intelligence. It’s about turning raw information into a real strategic advantage. If you want to go deeper on this, we've got a whole guide on what is competitive intelligence that breaks it all down.
Build Your Attack Plan
Let’s say you spot something specific. Maybe the big, scary incumbent has a terrible score for "Support for Small Businesses" because they're completely focused on enterprise deals. That’s your opening. You've just found your wedge into the market.
This single insight informs your entire go-to-market strategy:
- Marketing: Can spin up a campaign called "Project Management Built for the Little Guy."
- Sales: Should get battle cards that specifically counter the incumbent's weaknesses with small businesses.
- Product: Now knows to prioritize features that solve the unique headaches of SMB owners.
This kind of focused insight is incredibly powerful. Take the Win/Loss Matrix, for example, which is another great tool for analyzing deal data to see who your biggest threats are. In some B2B markets, a staggering 65% of deals are influenced by competitive intel. By using win/loss analysis, companies have been able to boost their close rates by as much as 27%. It’s all about making small, data-driven tweaks to your playbook based on who you're up against.
This is the part of your competitive matrix analysis where the real magic happens. You’re not just looking at a spreadsheet; you’re looking for leverage. You're searching for your rival’s exposed flank, the underserved customer, or that one feature gap you are perfectly positioned to fill. This is how you stop reacting to the market and start shaping it.
Turning Your Insights Into Actionable Strategy
Okay, so you've built the matrix, crunched the numbers, and found the story hidden in the data. High five! But let's be real—analysis without action is just an expensive hobby. A beautiful spreadsheet gathering dust on a shared drive doesn't help anyone win.
This is where the rubber meets the road. It's time to connect the dots between your competitive matrix and your actual, real-world strategy.
Your findings need to become the marching orders for your entire company. This isn't about one big, dramatic pivot. It’s about making a series of smart, targeted moves across different teams.
- For your product team: That integration you’ve been debating for months? The matrix shows it closes a major competitive gap. Time to bump it up the roadmap.
- For your marketing team: You scored highest on "Customer Support"? That’s your new headline for the next ad campaign. Build a landing page that hammers this key differentiator home.
- For your sales team: They need battle cards. Simple, one-page docs that equip them to shut down objections about specific rivals, using the weaknesses you just uncovered.
The goal is to turn your competitive matrix into a living, breathing document that drives decisions. It’s the foundation for how you go out and win your market.
From Grid to Growth Engine
Making major strategic decisions is easier with a framework. One of the classics is the GE-McKinsey Matrix, a 3x3 grid that has been helping huge companies make big bets since the 1970s. It plots business units on ‘Industry Attractiveness’ vs. ‘Competitive Strength.’
For example, Amazon reportedly used it for AWS back in 2023. AWS scored high on both attractiveness (thanks to 32% cloud market growth) and strength (31% market share), which helped justify a massive $25B capital expenditure. This shows how a simple grid can inform enormous resource allocation decisions based on where you stand. You can learn more about this powerful strategic tool.
> The Big Takeaway: Your matrix isn't just about identifying what to do. It’s just as much about deciding what not to do. It gives you permission to ignore the features your competitors are hyping if the data shows your customers don't actually care.
Once you’ve analyzed the competitive data, the next step is weaving these findings into your larger company strategy. For a deeper dive into structuring this, it's worth exploring a broader practical data analysis strategy.
Keeping Your Insights Fresh
The market doesn’t stand still, and neither should your analysis. A competitor will launch a new feature, an upstart will slash prices, or customer priorities will shift overnight. Your matrix needs to be a dynamic tool, not a static report you look at once a quarter.
Sure, big competitive intelligence platforms like Ahrefs or Semrush can help you track these changes, but they can be really expensive. For a more focused and accessible way to keep tabs on what your rivals are doing without needing a massive budget, a tool like already.dev is a fantastic alternative.
Ultimately, your competitive matrix analysis succeeds when it stops being a "project" and becomes part of your company's operational rhythm. It should fuel your weekly meetings, your quarterly planning, and your long-term vision.
A Few Lingering Questions
You've made it this far, so your head is probably spinning with new ideas for your own competitive matrix. But before you dive in, let's clear up a few common questions that always seem to pop up.
How Often Should I Revisit This Thing?
Great question. Your competitive matrix isn't a "set it and forget it" kind of document. Think of it more like a garden than a statue—it needs tending.
In a fast-paced market like SaaS, you'll want to give it a refresh at least quarterly. New competitors pop up, features get launched, and pricing models change constantly. If you wait too long, your insights will be stale.
For slower-moving industries, a semi-annual check-in might be enough. The real answer, though, is to let the market be your guide. Any time a major event happens—a competitor gets acquired, a new technology lands, a big funding round is announced—it's time to dust off the matrix and see what's changed.
What's the Biggest Mistake I Could Make?
Honestly, it's a tie between two classic blunders.
First, there's "analysis paralysis." This happens when you get a little too enthusiastic and create a monster matrix with 50+ features. You get so lost in the weeds that you never actually find an insight. Stick to the 5-10 factors that truly matter to your customers.
The second mistake, and it’s arguably worse, is scoring with your own biases. It’s so tempting to give your product a perfect '5' across the board, but that defeats the entire purpose. An analysis is only as useful as its honesty.
> Be brutally objective about where you fall short. Those weaknesses aren't failures; they're a treasure map pointing you straight to your biggest opportunities.
Can I Just Use a Spreadsheet, or Do I Need a Fancy Tool?
A spreadsheet is a fantastic place to start. For many teams, it’s all you’ll ever need. It's simple, flexible, and forces you to really think through the data you're collecting.
But if you want to automate some of the grunt work, there are plenty of competitive intelligence platforms out there. Tools like Ahrefs or Semrush are powerful for digging into marketing and SEO data, but they can be overkill (and pricey) if all you need is product and feature tracking.
For something more focused on the matrix itself, a tool like already.dev is a great option. It’s built specifically to help you gather competitor data and keep your analysis up to date without all the extra noise.
Ready to stop guessing and start winning? Already.dev uses AI to build your competitive landscape in minutes, not weeks. Uncover your rivals' strategies, find market gaps, and make data-driven decisions with confidence. Start your free trial at https://already.dev