How to Build a Competitor Analysis Table That Doesn't Suck
Tired of useless spreadsheets? Learn how to build a competitor analysis table that uncovers real insights and gives you a strategic edge. No fluff, just action.
Let's be real. Most competitor analysis tables are a total waste of time. They start as a good intention, morph into a massive spreadsheet nobody understands, and end up collecting dust in a forgotten Google Drive folder.
A truly useful competitor analysis table isn't just a data dump; it’s a living document that gives you sharp, clear insights to help you make better decisions, fast.
Your Competitor Analysis Is Probably a Waste of Time
This guide is all about getting practical. We're going to skip the corporate-speak and show you how to build a table that actually works. Forget just cataloging what your rivals are doing. The goal here is to create a tool that pinpoints their weaknesses, throws a spotlight on your strengths, and helps you spot those game-changing market gaps.
This isn't an academic exercise in chart-making. It’s about building a blueprint to systematically outmaneuver your competition. Let’s walk through a process that turns this chore into your new secret weapon.
Why Most Tables Fail
So, where does it all go wrong? Usually, a few common goofs doom the entire effort from the start. The main problem is focusing on what competitors are doing instead of digging into why it works—or, more importantly, why it doesn't.
- Feature-Obsessed Tunnel Vision: I've seen teams get lost for weeks creating an endless list of every single competitor feature. The result? A monstrous, unreadable spreadsheet with zero strategic value.
- The "One and Done" Mindset: The analysis gets done, it’s presented in one big meeting, and then it's immediately archived. The market keeps moving, but the analysis is frozen in time.
- No Clear Goal: The whole process kicks off without a specific question to answer. You need a purpose, like "How can we create a better onboarding flow?" or "Where are the holes in their pricing model we can exploit?"
> The goal is to move from 'Competitor X has this feature' to 'Competitor X has this feature, but their customers complain about it, and we can build something better.'
Building a Table That Works
To dodge these bullets, you have to approach this differently. Before you even think about opening a spreadsheet, you need a solid plan. It all starts with knowing exactly who you're up against. If you're a bit fuzzy on that, our guide on how to find competitors is the perfect place to begin.
A great analysis is less about data collection and more about smart interpretation. It means looking at their SEO performance, reading between the lines of customer reviews, and getting a feel for the entire competitive space. For a deep dive into structuring the whole process, this guide on how to do competitor analysis in SEO is incredibly thorough.
Of course, the right tools make this a whole lot easier. You can go deep with platforms like Ahrefs or Semrush, but they come with a hefty price tag. An alternative like already.dev can handle a lot of the initial data gathering automatically, which lets you jump straight to the strategic thinking.
Designing Your Table Columns to Find What Matters
Let's be honest, the columns you choose for your competitor analysis table will make or break the entire exercise. They're the difference between a spreadsheet that gathers digital dust and a genuine strategic weapon that informs your next move.
So please, don't just grab the first template you find on Google. Your columns need to answer the specific questions that are actually keeping you up at night. If a data point doesn't help you make a decision about your product, marketing, or sales strategy, it’s just noise.
This isn't just about a feature-for-feature showdown. It’s about understanding the entire world your competitor lives in.
The Foundational Columns Everyone Needs
Before you dive deep, you need to set the stage. These are the non-negotiable columns that give you the "who's who" of the competitive landscape.
- Company Vitals: This is your at-a-glance info. Think company name, website, founding year, and maybe employee count or recent funding. It quickly tells you if you're fighting a scrappy startup or a well-funded giant.
- Core Value Proposition: Simply put, what do they claim to do? Head to their homepage and grab the main headline. This is a direct window into how they position themselves.
- Target Audience: Who are they talking to? Is it enterprise clients, solo founders, or small businesses? Their website copy and customer case studies will spell this out for you.
Without these basics, you’re just comparing features in a vacuum—a classic rookie mistake.
Going Deeper Into Product and Pricing
Okay, now for the fun part. This is where you dissect what they’re actually selling and for how much. But don't just make a laundry list of features; look for the strategy behind them.
> The most valuable insights often come from what a competitor doesn't offer. Gaps in their product or confusing pricing tiers are your opportunities.
When it comes to pricing, you have to play detective. Look beyond the sticker price to understand the entire model.
- Pricing Tiers: List out all their public plans (e.g., Free, Pro, Enterprise).
- Key Limitations: What are the main walls customers hit in each tier? Is it based on users, projects, or access to one specific killer feature?
- Hidden Costs: Are there sneaky setup fees, mandatory training, or expensive add-ons?
- Free Trial / Freemium: Do they offer one? How long is it, and what does it include? This reveals a ton about their customer acquisition strategy.
Tracking these details shows whether they're trying to win on price, features, or service. That's critical intel for positioning your own offer. For a head start, our free competitor analysis template already has these columns built in.
Uncovering Their Marketing Playbook
A great product with mediocre marketing is an opportunity just waiting to be seized. A good competitor analysis table must have a section dedicated to how your rivals get the word out. This is where you find weaknesses to exploit.
Understanding your competition's strategy is big business. In fact, the market for competitive analysis tools hit $1,722.0 million in 2024 and is projected to nearly double by 2030. That shows you just how seriously companies are taking this.
You don't need to be an SEO guru to gather solid intel here. Start with a few simple but powerful metrics.
- Domain Authority (DA) / Domain Rating (DR): This is a 1-100 score that estimates a website's "SEO power." Tools like Ahrefs and Semrush offer this but can be pricey. A more accessible tool like already.dev can often pull this data for you as part of a broader analysis.
- Top Marketing Channels: Where is their traffic coming from? Organic search, paid ads, social media, or referrals?
- Content Strategy: Do they run a blog, a YouTube channel, or a podcast? Note the type of content they create and how often they publish.
- Social Media Presence: Which platforms are they active on? Look beyond follower counts and check their engagement. A million followers with two likes per post is just a vanity metric.
By understanding how they attract customers, you can decide whether to compete head-on, find an underserved channel they're ignoring, or target keywords they've missed.
Gathering the Data Without Losing Your Mind
Alright, you've mapped out the perfect columns for your competitor analysis table. Now comes the "fun" part—actually filling the beast in. This is where most people get lost in a caffeine-fueled haze of website stalking, endless scrolling, and signing up for way too many free trials.
Manually gathering this data can honestly feel like a part-time job you never asked for. You'll bounce between competitor homepages, try to decode their pricing pages (which seem intentionally confusing), and fall down the rabbit hole of G2 and Capterra reviews. It's tedious, but it's a necessary evil to get a real feel for their vibe.
> The goal of data gathering isn't just to find facts; it's to understand the story your competitors are telling their customers. You're looking for the gap between their marketing promises and the reality of their user experience.
And don't forget, a ton of valuable intel is often locked away in PDFs, like market reports or financial summaries. Getting that info out cleanly is a huge time-saver. Learning about extracting tables from PDF files is a skill that pays off big time here.
The Manual Grind vs. Automated Magic
Let's be real: the manual approach takes forever. While it's great for getting qualitative insights—like how slick their onboarding is or how annoying their sales team is—it's a terrible way to gather quantitative data at scale.
This is where specialized tools come in, but you have to be careful. Big-name SEO platforms like Ahrefs or Semrush are incredibly powerful for digging into keyword data and backlink profiles, but they're also seriously expensive. For a startup or small team, that monthly subscription can be a real gut punch. A more accessible alternative like already.dev can automate a lot of the grunt work without breaking the bank.
The demand for better options is clear. The entire competitive analysis tools market is projected to hit a valuation of USD 5.8 billion by 2033. That explosive growth shows just how critical this process has become.
A Smarter, Faster Way to Collect Intel
Instead of burning 40 hours trying to do everything by hand, you can lean on AI to do the heavy lifting. This is where a platform like Already.dev completely changes the game. You don't have to manually scrape a single website.
Its AI agents are built to crawl hundreds of sources—from product directories and tech forums to social media chatter—and pull the exact data you need. It can populate entire sections of your competitor analysis table with info on features, pricing, and market positioning in minutes, not days.
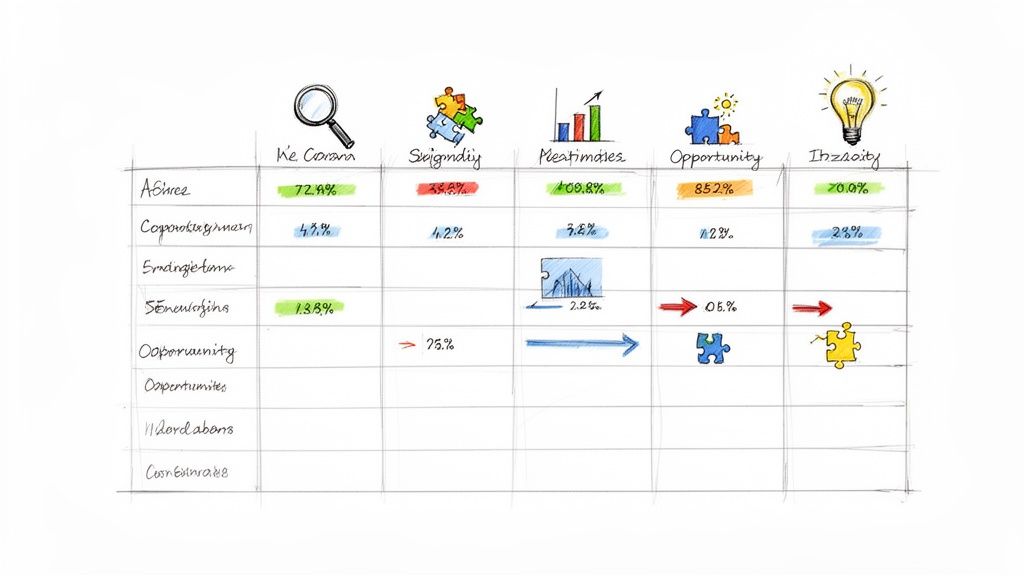
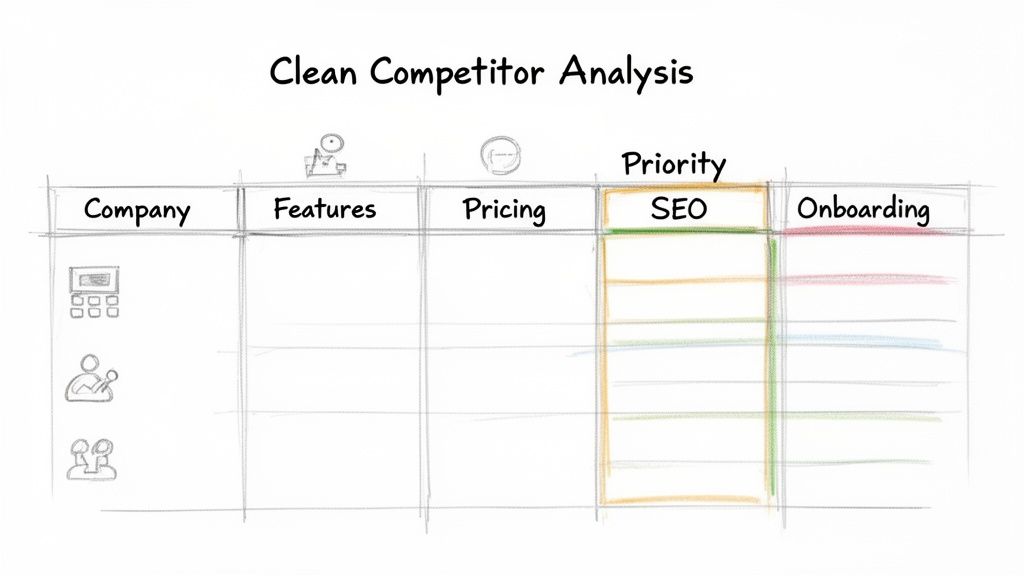
Here’s a glimpse of how it visualizes that data, making it instantly digestible.
What you're seeing is a clear, side-by-side comparison that would have taken hours to build by hand, delivered almost instantly. This frees you up to focus on strategy instead of mind-numbing data entry.
Blending Automation with Human Insight
The best approach I've found is a hybrid one. Let automation handle the grunt work, then use your human brain to add the context and nuance that a machine just can't grasp.
Here’s a practical workflow that works:
- Automate the Broad Strokes: Use a tool like already.dev to quickly identify your top 5-10 competitors and pull in their core data—features, pricing tiers, funding, and initial market positioning.
- Manually Dive Deep on the Top 3: Now that you have the lay of the land, pick your three most direct competitors. Sign up for their product. Go through their onboarding. Maybe even talk to their sales team.
- Cross-Reference and Validate: Compare the automated data with your hands-on experience. Does their product actually deliver on the features listed on their website? Is their "Pro" plan really worth the money?
- Add Your Own "Vibe Check": This is the qualitative gold. In your table, add a column for your own notes. Is their brand voice confident or quirky? Is their UI clean or cluttered? These details matter.
This blended method gives you the best of both worlds—the speed and scale of AI combined with the irreplaceable strategic insight of a human expert (that's you). If you want to explore more options, we've put together a list of the best competitor analysis tools to help you find the perfect fit for your needs and budget.
From Data Dump to Strategic Insights
So you’ve got a filled-out competitor analysis table. Fantastic. Right now, it’s a beautiful, glorious data dump—about as useful as a phonebook in a zombie apocalypse. It's just a collection of facts, and facts alone don't win you customers.
This is the part where so many people drop the ball. They do all the hard work of gathering the data and then just… stop. The real magic happens when you turn that raw information into a strategy that gives you a real edge. Let's dig in and find the gold.
It all starts with a solid, structured approach to data gathering. You need to make sure the information you’re about to analyze is actually reliable.
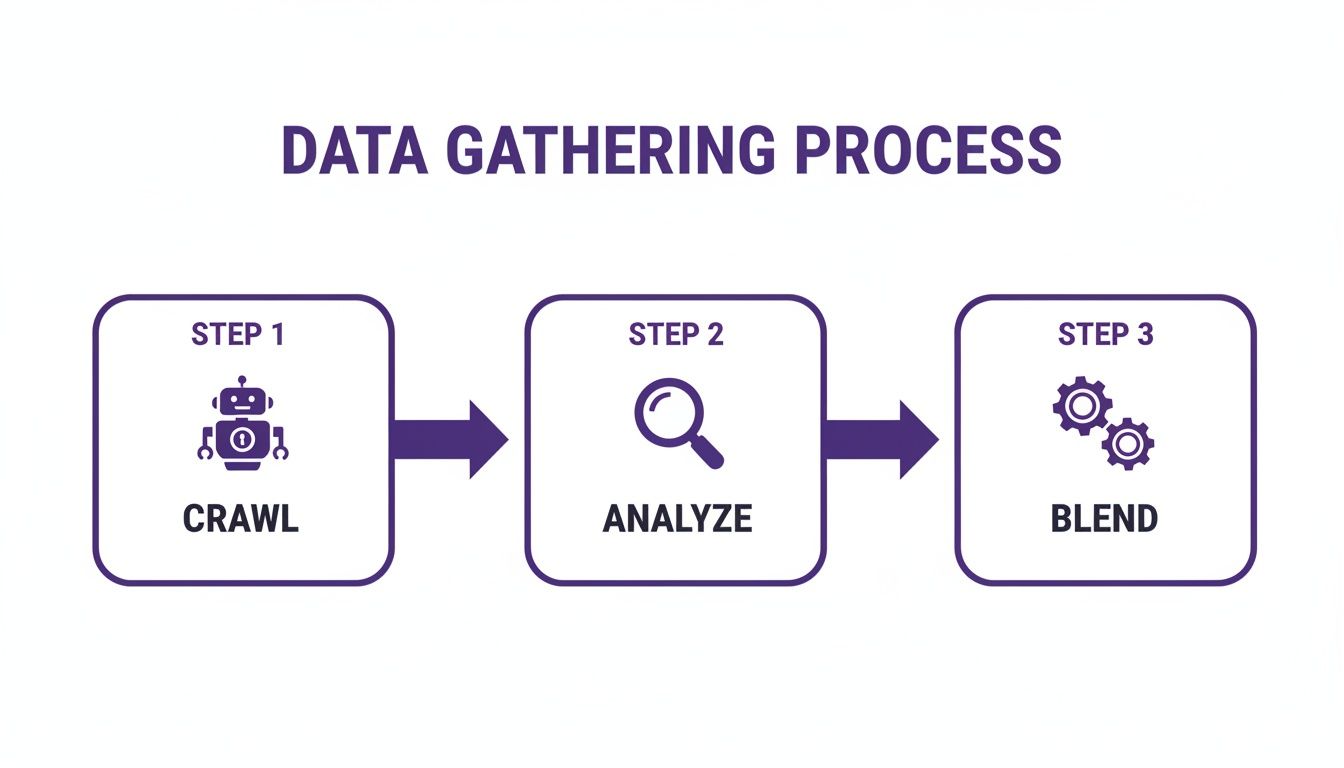
This simple flow—crawling your sources, analyzing what you find, and then blending it all into a cohesive picture—is the bedrock of turning raw data into something you can actually act on.
Creating a Scoring System That Actually Works
Gut feelings are great for picking a lunch spot, not for making six-figure business decisions. To get truly objective, you absolutely need a scoring system. This is how you stop saying, "Well, Competitor A feels better," and start saying, "Competitor A is objectively stronger in onboarding but weaker in customer support, and here's the data to prove it."
First, pick the factors that matter most to your customers. Seriously, don't just grab a generic list from another blog post. For a SaaS product, this might include things like:
- User Onboarding: How frictionless is it for a new user to get that first "aha!" moment?
- Feature Set: Do they have the core features that solve the primary pain point?
- Pricing Flexibility: Are their plans logical for different customer segments?
- Customer Support: How fast and helpful are they when something inevitably breaks?
Next, score yourself and your competitors on each of these factors, maybe on a simple scale of 1 to 10. A 1 means it’s a complete dumpster fire, while a 10 means it’s so good it makes angels weep. Be brutally honest here, especially when you're scoring your own product. No vanity scores allowed.
Adding Weights to Focus on What Matters
Let's be real: not all factors are created equal. Your customers might care way more about a clean, intuitive user interface than they do about having 50 niche features they'll never touch. This is where weighting comes in. It’s a simple but powerful way to give more importance to the things that actually drive purchasing decisions.
Assign a "weight" to each factor, say from 1 to 5. A weight of 5 means "this is absolutely critical to our customers," while a 1 is more of a "nice-to-have, but nobody's churning over it."
> The whole point is to create a final "weighted score" for each competitor. Just multiply the score by the weight for each factor. This instantly shows you who is winning in the areas that have the biggest impact on customer happiness and retention.
This process can reveal some surprising truths. You might discover that while a competitor has way more features (a high raw score), they're all in a low-weight category, meaning they don't actually matter much to users. Meanwhile, you could be absolutely crushing it in a high-weight area like customer support. Now that's a strategic advantage you can scream about in your marketing.
To make this crystal clear, here’s a simple scoring model in action.
Example Scoring System for Feature Analysis
| Feature | Weight (1-5) | Your Score (1-10) | Competitor A Score (1-10) | Competitor B Score (1-10) | Weighted Score (Yourself vs. Comps) | | :--- | :--- | :--- | :--- | :--- | :--- | | User Onboarding | 5 | 8 | 6 | 9 | You: 40, Comp A: 30, Comp B: 45 | | Core Feature X | 5 | 9 | 9 | 7 | You: 45, Comp A: 45, Comp B: 35 | | Customer Support | 4 | 9 | 5 | 6 | You: 36, Comp A: 20, Comp B: 24 | | Pricing | 3 | 7 | 8 | 8 | You: 21, Comp A: 24, Comp B: 24 | | Reporting | 2 | 6 | 9 | 7 | You: 12, Comp A: 18, Comp B: 14 | | Total Weighted Score| | | | | You: 154, Comp A: 137, Comp B: 142|
See how that works? In this scenario, Competitor B has a better onboarding experience, but you're dominating in high-value areas like Core Feature X and Customer Support, giving you the overall edge.
Visualizing the Battlefield
Staring at a spreadsheet full of numbers can make anyone's eyes glaze over. To make your findings truly pop, you have to visualize them. This isn't about making pretty charts for a slide deck; it's about creating simple visuals that reveal opportunities at a glance.
A classic 2x2 matrix is perfect for this. Pick two critical variables—like Price on the Y-axis and Feature Set on the X-axis—and plot where you and your competitors fall. This immediately shows you who's playing in the "cheap but basic" quadrant versus the "expensive and feature-rich" one. Better yet, are there any empty quadrants? That, my friend, is your opening.
Another killer visualization is a feature gap analysis. This is basically a checklist of all the important features in the market. You go down the list and mark off who has what. The magic happens when you spot a feature that customers are constantly begging for in reviews and on social media, but none of your competitors offer it. That’s not just a gap; it’s a giant, flashing neon sign that says, "BUILD THIS NOW."
Never underestimate the power of a sharp strategy. In the hyper-competitive food delivery space, DoorDash captured a staggering 65% of the total market through smart positioning and relentless execution. It’s a powerful example of how much ground you can gain with the right insights. You can read more about these winner-take-all market dynamics to see just how deep this stuff goes.
Ultimately, your goal is to move from a basic observation like "Competitor X has this feature" to a much more powerful insight: "Competitor X has this feature, but their customers are complaining that it’s clunky, and we know we can build a version that’s ten times better." That is how you turn a boring competitor analysis table into a roadmap for winning your market.
Putting Your Analysis Into Action
So, you’ve done it. You have a beautiful, color-coded competitor analysis table that’s packed with insights. Now what? Seriously, don’t let it become a digital ghost, haunting a forgotten folder in your Google Drive. This is where the real work begins—and where the payoff is.
An analysis without action is just expensive trivia. The whole point of this exercise is to turn those findings into real-world business decisions. It’s time to stop admiring your spreadsheet and start making moves.
From Findings to Action Items
The trick is to translate each key insight into a specific, ownable task. This doesn’t have to be complicated. You’re just creating a simple checklist that connects a “finding” to a “fix,” turning your research into a prescription for your business.
Let’s get practical. Here’s how you can turn common findings into a clear action plan:
-
The Finding: "Our biggest rival charges 20% more, but their G2 reviews are filled with customers raving about their incredible onboarding."
- The Action Item: Task the product team with a full audit of our own user activation flow. Their goal is to find three major friction points and propose fixes within the next sprint.
-
The Finding: "Two up-and-coming competitors are getting a ton of traffic from TikTok, a channel we’ve completely ignored."
- The Action Item: Assign the marketing team a two-week research spike. They need to analyze the top 10 relevant TikTok accounts in our niche and come back with three experimental video concepts we can test on a small budget.
-
The Finding: "Every single one of our competitors offers a 'Pro' tier for teams, but we only have individual plans."
- The Action Item: The CEO and product lead will model out a new pricing tier. They need to define its features, set a price point, and project the potential impact on monthly recurring revenue.
You see the pattern? Each action item is specific, has a clear owner, and is tied to a real business outcome. It’s not just a vague “we should improve our marketing”; it’s a concrete next step.
> Your competitor analysis table isn't just a report; it's a backlog of strategic initiatives waiting to be tackled. Think of it as a goldmine of proven ideas and validated customer pain points.
Telling a Story That Drives Decisions
Okay, let's talk about sharing your work. If you walk into a meeting and just slap that massive spreadsheet onto the screen, you'll be met with blank stares. Nobody wants to read your table. They want you to tell them what it means.
Your job is to be a storyteller. The data is your plot, and your strategic recommendations are the big finish. You need to craft a narrative that leads your team or your investors to the exact same conclusions you reached.
Here's a simple framework I've used to make my findings land with impact:
- The "What": Start with the single most surprising or important insight. "I dug into our top five competitors, and the big takeaway is this: we're losing deals because our customer support is seen as the slowest in the market."
- The "So What": Explain why this actually matters to the business. "This isn't just a minor complaint. Based on their review volume, we estimate this could be costing us up to $15,000 in new MRR every single month."
- The "Now What": Present your clear, actionable recommendation. "My proposal is to invest in a dedicated support tool and guarantee a two-hour response time. This would instantly make us the fastest in the industry and give our sales team a massive advantage."
This storytelling approach turns a dry data presentation into a compelling case for change. You’re not just showing off your research; you're building momentum and getting the buy-in you need to actually make things happen.
Keeping Your Analysis Alive
Finally, remember that the market doesn't stand still, and neither should your analysis. A competitive deep-dive you did in January is already a historical artifact by June. New features launch, pricing gets tweaked, and new rivals pop up out of nowhere.
To keep your hard work from going stale, set a simple schedule. A quarterly refresh is a great rhythm for most businesses. This doesn’t mean you have to do the entire project all over again. It’s just a quick check-in on the most important data points.
- Quarterly Quick Scan (2 hours): Look at your top three competitors. Have they changed their pricing? Announced a major new feature? Shifted their marketing message? Just update the key columns in your table.
- Annual Deep Dive (1-2 days): Once a year, do a more thorough review. Is there a new competitor who needs to be on your radar? It might be time to re-run your scoring and weighting to see if the landscape has fundamentally shifted.
This process becomes a lot less painful if you use tools to automate some of the monitoring. While platforms like Semrush and Ahrefs are great for tracking SEO data (and can be expensive), a tool like Already.dev can be set up to monitor broader changes, making these updates much faster. The goal is to create a living document that continually informs your strategy, not a static report that dies after one meeting.
Common Questions About Competitor Analysis Tables
So you’ve got the framework, you've started pulling in data, and you're turning it all into a real strategy. Fantastic. But let's be honest, a few nagging questions always pop up when you're deep in the spreadsheet trenches.
Let's clear the air and tackle the most common ones so you can move forward without second-guessing yourself.
How Many Competitors Should I Actually Track?
This is the classic question. The urge to track every single company that even remotely smells like a competitor is strong. My advice? Resist it. You'll just drown in data and end up with a table that’s a mile wide and an inch deep.
Instead, start small and stay focused. Pinpoint your top 3-5 direct competitors. These are the companies your customers are actually deciding between when they're about to make a purchase. Go deep on these guys.
What about everyone else? For them, you can create a "lite" version of your table. Track another 5-10 indirect competitors but don't obsess over every little detail. Just keep an eye on the high-level stuff: their main marketing channels, their overall market position, and any big news like major funding rounds. This gives you a broader market view without creating a ton of busywork.
What's the Biggest Mistake People Make With These Tables?
I see two mistakes all the time, and it's a toss-up for which one is worse. The first is treating your analysis like a one-and-done project. You spend a week building the perfect table, present it in a big meeting... and then it gets archived in a folder named "Q2_Initiatives_FINAL_v3," never to be seen again.
> A competitor analysis table is not a historical document; it's a living, breathing strategic tool. If you're making decisions based on six-month-old data, you're already behind.
The second huge mistake is getting tunnel vision. Too many people get completely obsessed with a feature-for-feature comparison. They end up with this exhaustive list but totally ignore the things that really matter, like marketing, pricing strategy, and the actual customer experience. The real competitive advantages are often found in how a company sells and supports its product, not just in what the product does.
How Often Should I Update My Competitor Analysis?
The right rhythm really depends on how fast your market moves. For most startups or companies in a fast-paced industry, a quarterly review is the sweet spot. This doesn't have to be a full-blown, week-long project; think of it as a quick refresh.
Here's a good cadence to follow:
- Quarterly Refresh (2-3 hours): Take a quick look at your main competitors. Have they changed their pricing? Launched a big new feature? Shifted their homepage messaging? Just update the key columns in your table.
- Annual Deep Dive (1-2 days): Once a year, it's time to go deeper. Re-evaluate your whole competitor list. Is there a new player on the scene that needs to be on your radar? This is also the perfect time to reassess your scoring and weighting to make sure they still reflect what your customers truly care about.
This whole process becomes way less of a chore if you use tools to help you out. While big platforms like Ahrefs or Semrush are great for SEO data (though they can be pricey), an AI-powered tool like Already.dev can automate a lot of the monitoring for you—tracking pricing, new features, and positioning. It makes those quarterly updates much faster and far less painful.
Feeling overwhelmed by the thought of building and updating your competitor analysis table? Let Already.dev do the heavy lifting. Our AI agents can build you a comprehensive report in minutes, not weeks, freeing you up to focus on strategy, not spreadsheets. Give it a try and see your market more clearly.