Business Intelligence Tools Comparison: Don't Pick The Wrong One
Cut through the noise with our business intelligence tools comparison. We help you choose the right BI tool for your team, no jargon allowed.

Picking a business intelligence tool feels like trying to order coffee at one of those fancy cafes—a million confusing options, and you just want something that works. Let's cut the crap. A good business intelligence tools comparison comes down to one simple thing: finding a tool your team will actually use without needing a PhD in data science or an unlimited budget.
So, let's forget the corporate jargon and those endless, soul-crushing feature lists for a minute.
Stop Guessing Which BI Tool Is Best
Most "Top 10 BI Tools" lists are just paid ads in disguise. You’re probably drowning in names like Power BI, Tableau, and a dozen others, all promising to magically turn your messy data into a work of art. This guide is different.
We're here to cut through the noise. I want to give you a simple framework for picking a BI tool that fits your team, your wallet, and what you’re actually trying to get done. Think of this as getting advice from a friend who already made all the expensive mistakes so you don't have to.
The BI software market is exploding. It was valued at $47.04 billion in 2025 and is projected to hit a wild $168.06 billion by 2035. Sure, giant corporations are a big part of that, but the real story is how many small and medium-sized businesses are jumping in. These are the teams that need to make smart, cheap decisions without getting bogged down in tech hell.
What Really Matters in a BI Tool
Instead of listing every feature under the sun, let's focus on what will make or break your experience. You need a tool that solves problems, not one that creates a bunch of new ones.
Here's what you should actually care about:
- Ease of Use for Non-Nerds: Can your marketing manager build a simple report without filing a ticket with the engineering department? If not, the tool will just sit there collecting digital dust.
- Plays Nice with Your Other Toys: How easily can it connect to the stuff you already use? I’m talking about your CRM, your Stripe account, and that weird, custom database your engineers built back in 2018.
- The Actual Price: We'll dig into the real cost, which is way more than that "per-user" fee they advertise. Nobody likes surprise bills.
> The goal isn't to find the "perfect" BI tool. It's to find the "right-fit" tool that solves your biggest data headaches today and can grow with you.
Learning how to pick software is a vital skill, whether you're hunting for BI platforms or other key tools. For example, finding the best project management tools involves the same balancing act of features, usability, and price.
It's just like the world of marketing tools. You have powerful but seriously expensive options like Ahrefs or Semrush, but often a smarter, more affordable alternative like already.dev is a much better fit for getting competitive research done. The same logic applies right here.
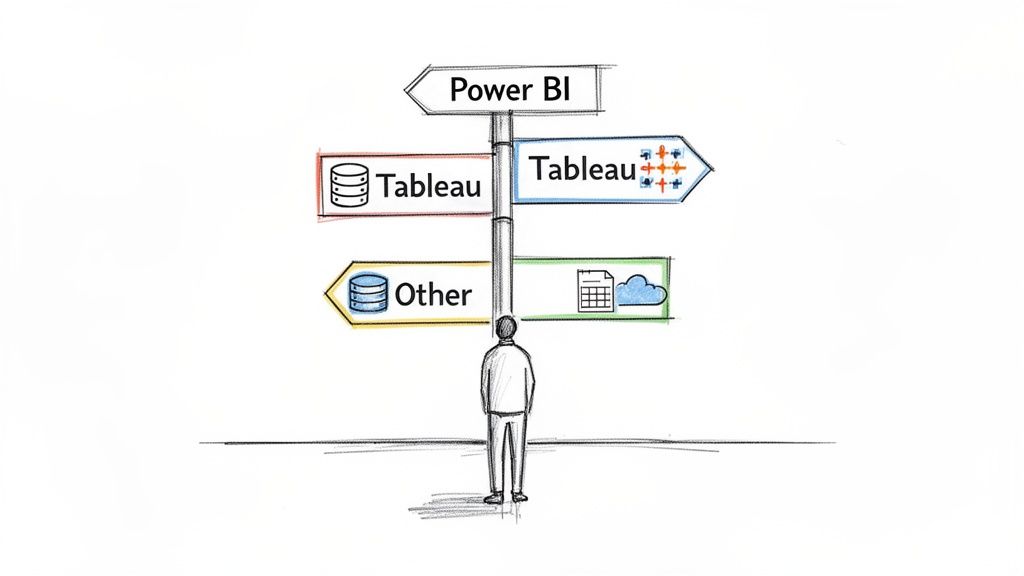
Quick BI Tool Matchmaker
Sometimes you just need a nudge in the right direction. Use this cheat sheet to match your company's goal with the kind of BI tool you should check out first.
| If Your Main Goal Is... | You Should Look At... | Why It's a Good Fit | | :--- | :--- | :--- | | Quickly analyzing data from Microsoft apps. | Microsoft Power BI | It hooks into Excel, Azure, and Teams flawlessly. If you live in spreadsheets, this is your home base. | | Creating stunning, interactive data visuals. | Tableau | It’s the king of beautiful, presentation-ready dashboards that make you look smart in front of investors. | | Letting everyone explore data without code. | Looker (Google Cloud), Holistics, or Metabase | These tools are built for "self-service," meaning non-techies can ask questions and get answers on their own. | | Getting started for free with basic dashboards. | Google Looker Studio or Power BI Desktop (Free) | Both have seriously good free versions that are more than enough for startups to track KPIs without spending a dime. |
This table should give you a solid starting point, but remember, the devil's in the details. As we dive deeper, you'll get a clearer picture of which one is the best match for your team.
Comparing The Heavyweights: Power BI vs. Tableau
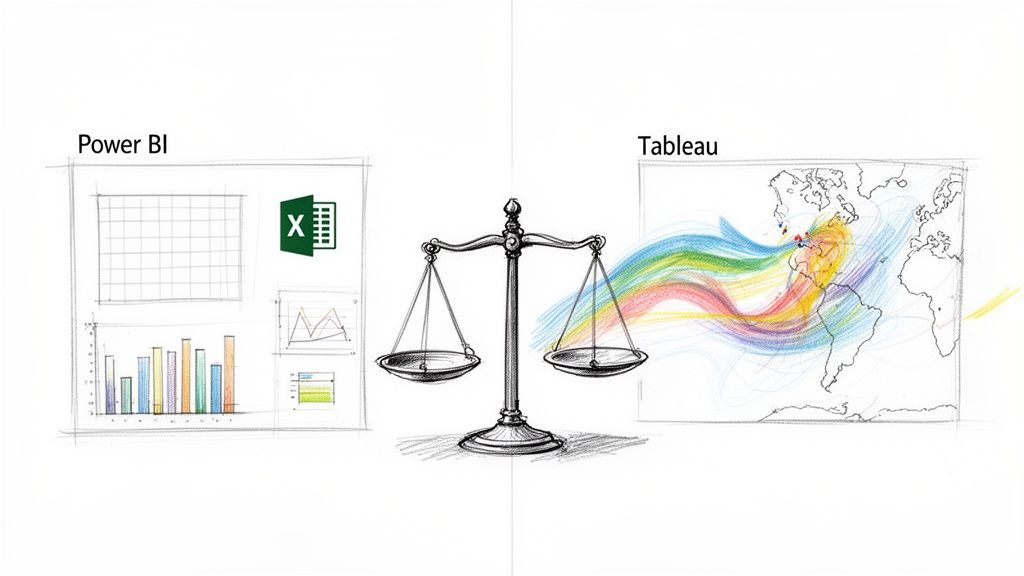
Alright, let's get to the main event. In one corner, you've got the beast from Microsoft, Power BI. In the other, the artsy champion known for its stunning visuals, Tableau. This is the classic showdown most people face.
Honestly, picking between them is like choosing between a tank and a sports car. Both are powerful, but you wouldn't take a tank to a street race. It’s all about matching the tool to the job.
The Microsoft Devotee vs. The Data Artist
Think of Power BI as Excel on steroids. If your team lives in spreadsheets and your company runs on Microsoft everything, Power BI is the obvious choice. It plugs into the Microsoft ecosystem so well it feels like cheating.
Tableau, on the other hand, is for the artists. It’s famous for creating gorgeous, interactive visuals that can make boring sales data look like a masterpiece. This is the tool you use when you need to wow people and tell a story with your numbers.
Power BI vs Tableau Feature Face-Off
When you get down to the nitty-gritty, how do they really compare? This isn't just a list; it's about what actually matters for a startup or product team.
| Core Feature | Microsoft Power BI | Tableau | | :--- | :--- | :--- | | Data Visualization | Strong on standard business charts (bars, pies, lines). Functional and clear. | The undisputed king of beautiful, custom, and interactive visuals. The Michaelangelo of data. | | Ease of Use | Super intuitive if you know Excel. If you can use PowerPoint, you can use this. | A more flexible, drag-and-drop canvas that’s fun to explore but has a steeper learning curve. | | Data Connectivity | Excellent with Microsoft products (Azure, SQL Server, Excel). A bit clunky elsewhere. | Has a massive library of connectors; known for handling huge, messy datasets without crying. | | Pricing Model | Much cheaper to start with. Power BI Pro is a bargain for small teams. | Generally a higher per-user cost. Its "Creator" licenses can make your CFO nervous. | | Integration | Deeply embedded in Microsoft 365 and Azure. It's part of the family. | Plays well with others, but doesn't have that "plug-and-play" feel like Power BI does in a Microsoft shop. |
Ultimately, Power BI is built for speed and efficiency inside its own world, while Tableau is built for deep visual exploration and making data look sexy.
Data Connectivity and Setup
So, how do they actually connect to your data? Power BI makes hooking up to Microsoft sources—like SQL Server, Azure, or a simple Excel file—ridiculously easy. It’s built to feel familiar, so your team can get moving fast.
Tableau has a huge library of connectors and is praised for its ability to chew through massive, complex data from all sorts of places without breaking a sweat. It's a real workhorse.
> The big question isn't "which tool connects to more sources?" It's "which tool connects to your sources with the least amount of pain?" Start there, and you'll save yourself a world of hurt.
Building Dashboards: The User Experience
Creating your first dashboard is where you see their true colors. Power BI has an interface that feels instantly comfortable if you've spent years in Excel. It's structured and designed for efficiency.
Tableau is more like a blank canvas. Its drag-and-drop interface encourages you to play around and find insights visually. This flexibility is what allows for those jaw-dropping dashboards, but it can be a bit intimidating for total beginners.
The market share numbers don't lie. Microsoft Power BI is the clear leader, with over 30% of the market as of 2021. That's way ahead of competitors like Tableau, which has around 17%. Data from HG Insights shows that Power BI is used by over 215,000 companies, which says a lot about its massive adoption.
When To Pick Power BI
You should lean heavily toward Power BI if:
- You're a Microsoft Shop: Your data is in Azure, your team lives on Teams, and Excel is your love language.
- Budget is a Big Deal: Power BI Pro is way cheaper per user than Tableau, making it an easy choice for startups.
- You Need Dashboards Now: You need functional, clear dashboards immediately and don't have months to train everyone.
When To Pick Tableau
Tableau is probably your winner if:
- Visuals Are Everything: You need to present data to investors or clients and it has to look amazing.
- You Have Huge, Messy Data: Your data team needs to connect to tons of different sources and perform complex analysis.
- Your Team Includes Data Nerds: You have people who are comfortable exploring data and want the freedom to create unique, custom visuals.
At the end of the day, they're both great tools. For a deeper dive, check out this comprehensive business intelligence software comparison. The best choice has less to do with a feature list and more to do with your team's DNA and your budget.
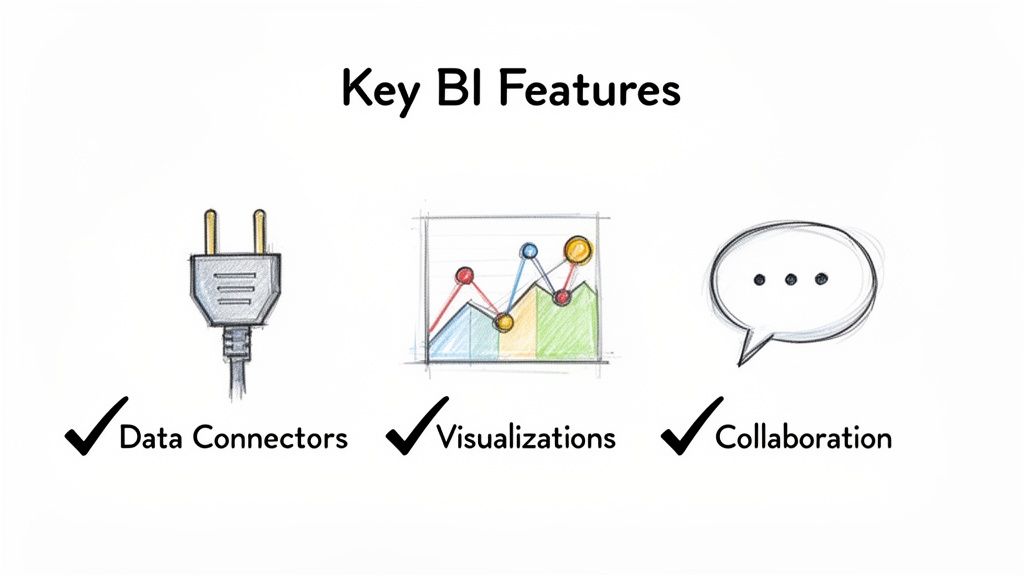
The BI Features That Actually Matter
Let's be real. Every BI tool's website throws a bunch of buzzwords at you. "AI-driven predictive analytics," "networked data governance"... it's all just noise designed to confuse you.
Forget 90% of that junk. When you’re doing a business intelligence tools comparison, your success comes down to a few features that actually solve real problems. It's time to cut the marketing fluff.
Can It Connect to Your Stuff?
This is it. Priority number one. A BI tool is useless if it can't talk to your data. Before you even watch a demo, ask one question: "Can this thing easily plug into my world?"
Your "world" is probably a mix of a few key things:
- Payment Processors: Stripe, PayPal, or whatever you use to get paid.
- CRMs: HubSpot, Salesforce, or that homegrown system your devs swear is "better."
- Databases: That weird PostgreSQL database the engineers set up, or maybe just a simple Google Sheet.
- Ad Platforms: Google Ads, Facebook Ads, LinkedIn Ads—you get it.
If connecting these sources requires a three-week engineering project, run away. A good BI tool will have native, one-click connectors for the platforms you use. Setup should be a 15-minute task, not a multi-week nightmare.
> The best BI tool is the one that kills the "Can you just export this to a CSV for me?" requests. The goal is automation, not giving your team more manual crap to do.
Does It Make Your Data Look Good (and Smart)?
Okay, the data is flowing. Now what? You need to visualize it. I'm not talking about another boring bar chart you could've made in Excel. The whole point of a BI tool is to uncover things you couldn't see before.
A great tool gives you visuals that actually mean something. Can you easily build a sales funnel to see where customers are dropping off? Can you plot users on a map to plan your next marketing campaign? If a tool's visualization library feels like it's stuck in 2010, your insights will be too.
For a deeper look into this process, our guide on performing market research data analysis can provide a solid framework.
Can You Share It Without Crying?
This is the final boss: collaboration and sharing. You've connected your data and built a beautiful, insightful dashboard. Awesome. Now you need to show it to your boss, your investors, or your team on Slack.
This is where so many tools fall apart. The process becomes a nightmare of user permissions, broken links, and static screenshots that are outdated the second you hit "send."
A truly useful BI tool makes sharing dead simple:
- Live Dashboards: Can you send a link where the data is always up-to-date?
- Easy Embedding: How hard is it to drop a live chart into a Notion doc or a Slack channel?
- Sensible Permissions: Can you easily control who sees what without needing a PhD in system administration?
Your BI tool isn't just for you; it's a communication device for your whole company. If it can’t communicate clearly, it has failed.
Understanding The True Cost Of BI Tools
Let's talk about money. When you're comparing BI tools, pricing isn't just a number; it's a maze designed to confuse you. You see a simple "per-user, per-month" price and think, "Hey, that's not so bad!"
Slow down. That sticker price is just the tip of the iceberg. It’s like buying a cheap printer only to find out the ink costs more than the printer itself.
Demystifying The "Per-User" Shell Game
Most big BI platforms, especially giants like Tableau and Power BI, have tiered pricing based on what a user can do. This sounds logical, but it means you're paying different amounts for different people, and those needs can change fast.
It usually breaks down like this:
- Creators/Designers: These are your power users—the ones building the dashboards. They get the priciest licenses.
- Explorers/Analysts: This group can mess around with existing dashboards and dig into the data. Their licenses are mid-tier.
- Viewers: These folks are in "look but don't touch" mode. Their licenses are the cheapest, but they can't do much.
The problem is that a "Viewer" today could need to be an "Explorer" tomorrow. As your team gets more data-savvy, your monthly bill quietly creeps up.
The Hidden Costs That Always Get You
Beyond user licenses, a bunch of "gotchas" are waiting to ambush your budget. These are the things that don't show up on the pretty pricing page.
For example, Power BI’s Pro license is famously cheap at around $10/user/month. But what happens when you need more power? You have to jump to Power BI Premium, which starts at a gut-wrenching $4,995 per month. Ouch.
Tableau is more upfront with its higher per-user cost ($75/user/month for a Creator), but hidden fees can still pop up. Need a special connector? That might be extra. Need support because a critical dashboard broke? Get your credit card ready.
> The real cost of a BI tool isn't what you pay in month one. It's what you'll be paying in month twelve, after you've discovered all the "premium" features you suddenly can't live without.
Don't Get Locked Into Expensive Contracts
This is where you need to think ahead. It's a classic software story. You see it with powerful marketing tools like Ahrefs or Semrush, which can get really expensive as your needs grow.
BI platforms play the same game. They want to get you hooked and make it too painful to leave.
That's why it's so important to look for alternatives with more wiggle room. For other business needs, like competitive research, a platform like already.dev lets you start smart with flexible plans, so you don't get trapped. Bring that same mindset to choosing your BI tool.
Start small. Map out your user growth for the next year. And ask vendors direct questions about the costs of connectors, API access, and support. Don't let a low entry price fool you.
How To Choose The Right BI Tool For You
Alright, we’ve covered the features, the big players, and the confusing pricing. Now for the hard part: making a choice. But don't freak out—this isn't about finding some mythical "perfect" tool. It’s about finding the right-fit tool for your team, right now.
Think of it like buying a car. You wouldn’t get a giant pickup truck if you live in a tiny city apartment. This simple framework will help you pick the right vehicle for your needs.
Who Is Actually Going To Use This Thing?
First, be brutally honest about your team's technical skills. Are they all Excel wizards who dream in pivot tables? Or are they brilliant marketers who get a nervous twitch when they hear the word "SQL"?
There’s no right answer, but self-awareness is key.
- For the Excel Masters: If your team is already deep in spreadsheets, a tool like Power BI will feel like coming home. It's powerful without a huge learning curve for Microsoft nerds.
- For the Total Beginners: If the goal is to get everyone using data, you need something laughably simple. Check out Metabase or the free Google Looker Studio, which are built for normal people.
- For the Data Storytellers: Got people who need to sell a story with data to investors? A trial of Tableau is a no-brainer. It was born to create those "wow" moments.
Choosing a tool that matches your team’s skills is the most important factor for getting people to actually use it. A powerful tool nobody touches is just an expensive paperweight.
This flowchart shows how the sticker price is just the tip of the iceberg once you factor in scaling, users, and hidden fees.
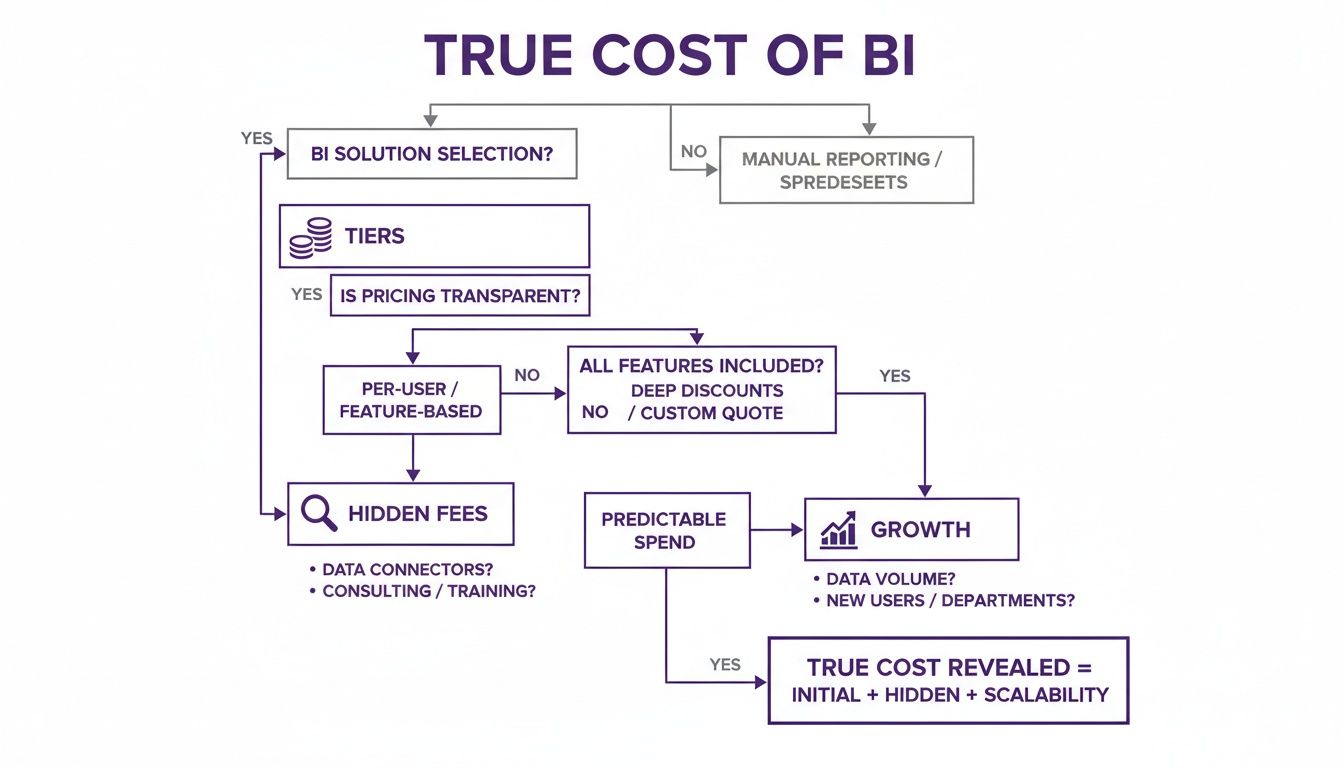
The lesson here is that the initial fee is just the starting line. The true cost shows up as your team grows and your needs get more complex.
What’s Your Tech Stack and Budget?
Next, look at the tools you already use. A good BI tool should slide into your existing workflow like it was made for it, not feel like you’re trying to jam a square peg into a round hole.
Are you a die-hard Microsoft shop? Then Power BI Pro is the path of least resistance. All-in on Google? Looker Studio will feel like home.
Then there’s money. Are you a bootstrapped startup where every dollar counts, or a VC-backed company with cash to burn?
> If you're a startup founder who lives in Excel and uses Azure, just start with Power BI Pro. It's the most logical, cheapest first step. If you need to present beautiful data stories, trial Tableau to see if the premium price is worth it.
Your budget dictates your starting point. Don't get hypnotized by enterprise tools with insane monthly fees. Start with a solid free or low-cost option. You can always upgrade later.
Putting It All Together
Okay, let's make this simple. The goal is to escape analysis paralysis and just get started.
- Define ONE Problem: What's the single most annoying report you have to pull right now? Is it a weekly sales report? Figuring out customer churn? Pick one painful problem to solve first.
- Run a Two-Week Trial: Sign up for a free trial of the tool that seems like the best fit. Hook it up to your real data (not the demo crap) and try to solve that one problem.
- Ask Two Questions: At the end of two weeks, ask your team: "Did this save us time?" and "Did we learn something new?"
If you get a "yes" to both, you've probably found your winner. It's that simple.
Picking the tool is just step one. To make sure you get the most out of it, check out our guide on business intelligence best practices. It'll help you build a solid foundation from day one.
Frequently Asked Questions About BI Tools
Alright, let's tackle some common questions that pop up during a business intelligence tools comparison. I've heard these a million times, so let's get straight to it.
What's The Biggest Mistake Startups Make When Choosing A BI Tool?
Hands down, they overbuy. It’s easy to get charmed by a slick demo of a massive enterprise platform with a million features you will literally never use. You end up paying for a sledgehammer when all you needed was a regular hammer.
The result is always the same. That expensive, complicated tool sits unused because no one has the time to figure it out. Before you know it, everyone’s back in Google Sheets, and you've wasted a ton of money.
Start simple. Seriously. Find a tool that solves your one or two biggest problems right now. You can always upgrade later when you're bigger and richer.
Do I Really Need A BI Tool Or Can I Just Use Google Sheets?
For a tiny, two-person team, spreadsheets are fine. But you will hit a wall, and you'll hit it fast. The second you start pulling data from multiple places, spreadsheets become a slow, clunky mess.
They’re also terrible for live, automated dashboards. And don't even get me started on version control—trying to figure out who has the "latest" version of a report is a nightmare. If you’ve ever seen a file named Sales_Report_Final_v3_USE_THIS_ONE.xlsx, you know the pain.
You need a BI tool when you have to connect multiple data sources (like your CRM and payment processor), automate reports, and let non-techies explore data without bugging an engineer every five minutes.
How Do I Run A BI Tool Trial Effectively?
A good trial isn't about recreating every report your company has ever made. That's a recipe for disaster. The goal is to solve one specific, high-value problem that’s a real pain for your team.
Here's a simple plan:
- Define a Clear Goal: Pick something concrete, like "Create a dashboard showing customer acquisition cost by channel, updated daily."
- Use Your Real Data: Don't use the vendor’s sample data. Hook the tool up to your actual, live data. This is the only way to see if it breaks.
- Set a Two-Week Deadline: At the end, ask the team two simple questions: "Did this tool save us time?" and "Did it give us a new insight we didn't have before?"
If the answer to both is "yes," you've likely found your winner.
Are There Good Free Alternatives To The Big Names?
Absolutely! You don’t have to spend big bucks on day one. Google Looker Studio is a fantastic—and completely free—option, especially if your data is already in the Google world (Analytics, Sheets, etc.).
Microsoft Power BI also has a very generous free desktop version that’s perfect for individual analysis. While these free tools lack the collaboration features of their paid siblings, they are more than powerful enough for most startups. They let you learn the ropes with zero risk.
> BI is all about understanding what's happening inside your company. But what about the world outside? Knowing your competitors is just as crucial.
For that, you'll want to check out the best competitive intelligence tools, which give you that external view. While BI helps you optimize your operations, competitive intelligence helps you find your strategic edge.
It’s like how SEO tools work. You have the big, expensive platforms like Ahrefs or Semrush, but then you have smarter alternatives like already.dev that deliver key insights without the massive price tag. Finding the right tool for the job is always the best move.
Ready to stop guessing about your competition and start making data-driven decisions? Already.dev uses AI to uncover every competitor, analyze their features, and map out their market positioning in minutes, not weeks. Get your free competitive research report today.