Master Market Research Data Analysis for Better Insights
Unlock the power of market research data analysis with easy methods. Turn data into actionable insights and drive smarter business decisions.

Let's be real: staring at a giant spreadsheet packed with survey answers is about as fun as watching paint dry. This is exactly where market research data analysis swoops in to save the day. It’s the magic that turns that chaotic jumble of numbers and opinions into smart business moves.
What to Do When You're Drowning in Data
Forget the dry, textbook definitions for a minute. At its core, data analysis is all about figuring out what your customers actually want, not just what you think they want. It’s the crucial step that stops you from making decisions based on hunches and gets you on the path to using real evidence.
Honestly, it's less about memorizing complex formulas and more about asking the right questions. Your goal is to find the nuggets of gold hidden within all that information.
Ultimately, you're trying to turn raw, messy data into a clear story. Are people jumping ship to a competitor? Is there a specific feature they absolutely love that you barely even promote? These are the kinds of questions that good data analysis answers, saving you from pouring time and money down the drain based on a bad guess.
Why This Matters More Than Ever
In business, a good gut feeling can get you started, but insights backed by actual data will help you win. The global market research industry is on track to hit a massive $140 billion in 2024, which shows just how vital this process has become for companies of all sizes.
Even with all the fancy new tech, online surveys are still the top choice for 85% of professionals looking to gather concrete data. You can dig deeper into the latest market research statistics to get the full scoop. This entire industry thrives on one simple principle: helping businesses truly understand their audience.
> The goal isn’t just to collect data; it's to find the human story within the numbers. An insight that doesn't lead to action is just a fun fact.
Think of yourself as a detective. You’ve gathered the clues (your data), and now you're looking for patterns (the analysis) to solve the case (make a smarter business decision). It’s all about connecting the dots between what people say and what they actually do.
Setting Clear Goals for Your Research

Let's be honest. Diving into data without a clear plan is like starting a road trip with no destination—you'll burn a lot of fuel and end up completely lost. Before you even think about looking at a single data point, you have to know exactly what you’re trying to find out. This is the one step you absolutely cannot skip.
Are you trying to figure out why sales suddenly tanked last quarter? Or maybe you're testing the waters for a new, wild idea, like a hot-dog-flavored soda (please, don't). Whatever your mission, you need a crystal-clear objective.
Think of it as drawing a treasure map before you start digging. Without one, you're just making a mess of the yard, hoping to stumble upon gold. A sharp, well-defined goal ensures every bit of effort you put in actually gets you closer to an answer.
From Vague Ideas to Actionable Questions
A good research goal isn't some fuzzy, high-level ambition; it’s a specific question that demands a real answer. "I want to grow my business" is a great wish, but it’s a terrible research objective. It's way too broad to be useful.
What you need to do is sharpen that wish into a focused, answerable question. This is how you turn a vague idea into a research project you can actually tackle.
Here's what that looks like in practice:
-
Vague Idea: "We need more customers."
-
Actionable Question: "What are the biggest frustrations our target audience has that our competitors are completely ignoring?"
-
Vague Idea: "Our new feature is a flop."
-
Actionable Question: "Which user segments are using the new feature the least, and what are the common complaints showing up in their support tickets?"
See the difference? The second versions give you a clear direction. You know exactly what kind of data to hunt for and where you might find it. This simple mindset shift is the secret sauce to effective market research.
What Kind of Treasure Are You Hunting For?
Once you have your question nailed down, you can figure out what kind of "treasure"—your data—you need to find. The question you're asking will point you toward the right data collection methods. There's no single right way to do it; it all depends on what you need to know.
For instance, if your goal is to understand why customers feel a certain way about your product, you're going to need qualitative data. This is the "story" data.
> Back in 1924, P&G started its legendary market research by asking a simple question: How were people actually using Ivory soap? They went door-to-door to find out, proving that a deep understanding of the customer was the real key to building an empire.
To get this kind of rich, narrative-driven info, you could:
- Run one-on-one interviews: Nothing beats a real conversation with your customers, whether it's face-to-face or over a video call.
- Organize focus groups: Get a handful of people together to chat about a topic. You’d be surprised by the insights that emerge when they bounce ideas off each other.
- Mine social media comments and reviews: Your customers are already talking about you online. You just have to tune in and listen.
On the flip side, if your question is about how many or how often, you'll need quantitative data—the cold, hard numbers. For this, you might:
- Send out online surveys: A classic for a reason. They're perfect for getting structured answers from lots of people.
- Analyze your website traffic: Dig into your analytics to see how people move through your site, what they click on, and where they leave.
- Dive into your sales data: Your own transaction history is a goldmine of purchasing patterns and trends waiting to be discovered.
The most powerful insights usually come from mixing both. The numbers tell you what is happening, and the stories tell you why. For example, your sales data might show a dip in repeat customers (the "what"), while customer interviews reveal a recent update made your app confusing to use (the "why").
If you want an easier way to see what your competitors are doing, our guide on how to identify competitors can make that part of your research a whole lot simpler. While tools like Semrush or Ahrefs are great for this, their price tags can be a bit steep. For a more budget-friendly option, a tool like already.dev gives you powerful competitive insights without the massive investment.
Cleaning Up Your Messy Data

Alright, let's talk about the least glamorous—but most critical—part of any solid market research project: data cleaning.
Your raw data is probably a hot mess. Seriously. It’s likely riddled with typos, duplicate entries, people who answered "BURRITO" for their age, and all sorts of other chaos. If you try to analyze this digital garbage pile, you’ll get garbage insights. It’s that simple.
Think of it like decluttering your garage. It’s a pain, I know. But you'll be so glad you did it when you can actually find what you're looking for.
First Pass: Catching the Obvious Goofs
Before you get into the heavy lifting, you need to hunt down the easy-to-spot errors. These are the little gremlins that sneak into every dataset, no matter how carefully you collect it. They seem small, but they can completely derail your analysis.
Imagine you're analyzing customer location data. If your dataset has "NY," "New York," and "new york" all as separate entries, your software will see them as three different places. Suddenly, your biggest customer hub looks tiny because it’s been fractured into pieces.
Here’s your initial hit list:
- Typos & Spelling Errors: Go on a search-and-destroy mission for simple misspellings, especially in fields where people typed their own answers.
- Funky Formatting: Unify things like date formats (e.g., "10/05/2024" vs. "Oct 5, 2024") and capitalization. Consistency is your best friend.
- Duplicate Entries: Find and nuke any responses that are exact copies. It usually just means someone got a little too click-happy with the "submit" button.
This first sweep is all about standardization. The goal is to make sure the same piece of information looks the same, every single time. It’s the foundation you’ll build your entire analysis on.
What to Do with All the Blank Spaces?
Okay, you’ve fixed the typos. Now you’re staring at a bigger problem: missing data. What do you do when a user skips a question or an entry is just plain empty? Your first instinct might be to just delete the whole row.
Hold on. Don't do it!
If you delete every entry that has a missing value, you could end up tossing out a massive chunk of your hard-earned data. There are much smarter ways to handle those blanks.
> You wouldn't throw away a whole pizza just because one slice is missing a topping. Treat your data the same way. The goal is to preserve as much context as possible.
Instead of hitting delete, consider your options:
- Imputation: This is just a fancy word for making a smart guess. For a blank in a number-based column (like age), you could fill it with the average or median value from that same column. For a category (like "Yes/No"), you might use the most common response.
- Leave It Be (Sometimes): Some analysis tools are smart enough to handle missing values on their own. If your software can manage it, leaving the data blank might be the most honest approach.
- Flag It: My personal favorite. Create a new column to mark rows that had missing data. This lets you analyze if the people who skip certain questions share other traits. That's an insight in itself!
The right move depends on your project and how much data is missing. The key is to be thoughtful, not destructive.
The Rise of Digital Data and Its Quirks
The way we gather data has changed dramatically. There's been a huge shift to digital collection, with around 60% of all research now happening online. This change is all about getting faster results and reaching people in new ways. If you're curious, you can read more about the industry’s migration to digital research and the unique challenges that come with it.
This digital-first world makes some parts of data cleaning easier (no more trying to decipher messy handwriting!), but it introduces new headaches. For instance, you have to be on the lookout for survey bots that fill out forms with nonsense answers.
It also means you’re working with a wider variety of data, from simple poll answers to complex website behavior. Cleaning it all up requires a sharp eye for what looks "off" and a solid plan to get everything consistent and ready for analysis.
Finding the Story Hidden in Your Numbers
So, you’ve wrangled your messy data into submission. It’s clean, organized, and ready for its moment in the spotlight. This is where the real fun begins—actually finding the story hidden inside all those numbers and comments. Think of yourself as a detective, piecing together clues to find those "aha!" moments that can change everything.
Don't worry, you don't need a PhD in statistics for this. We're going to break down the core analysis techniques without the scary jargon. It's really all about asking a series of simple questions to make sense of what you've gathered.
This flowchart gives a great overview of the journey from raw, messy data to something you can actually work with.
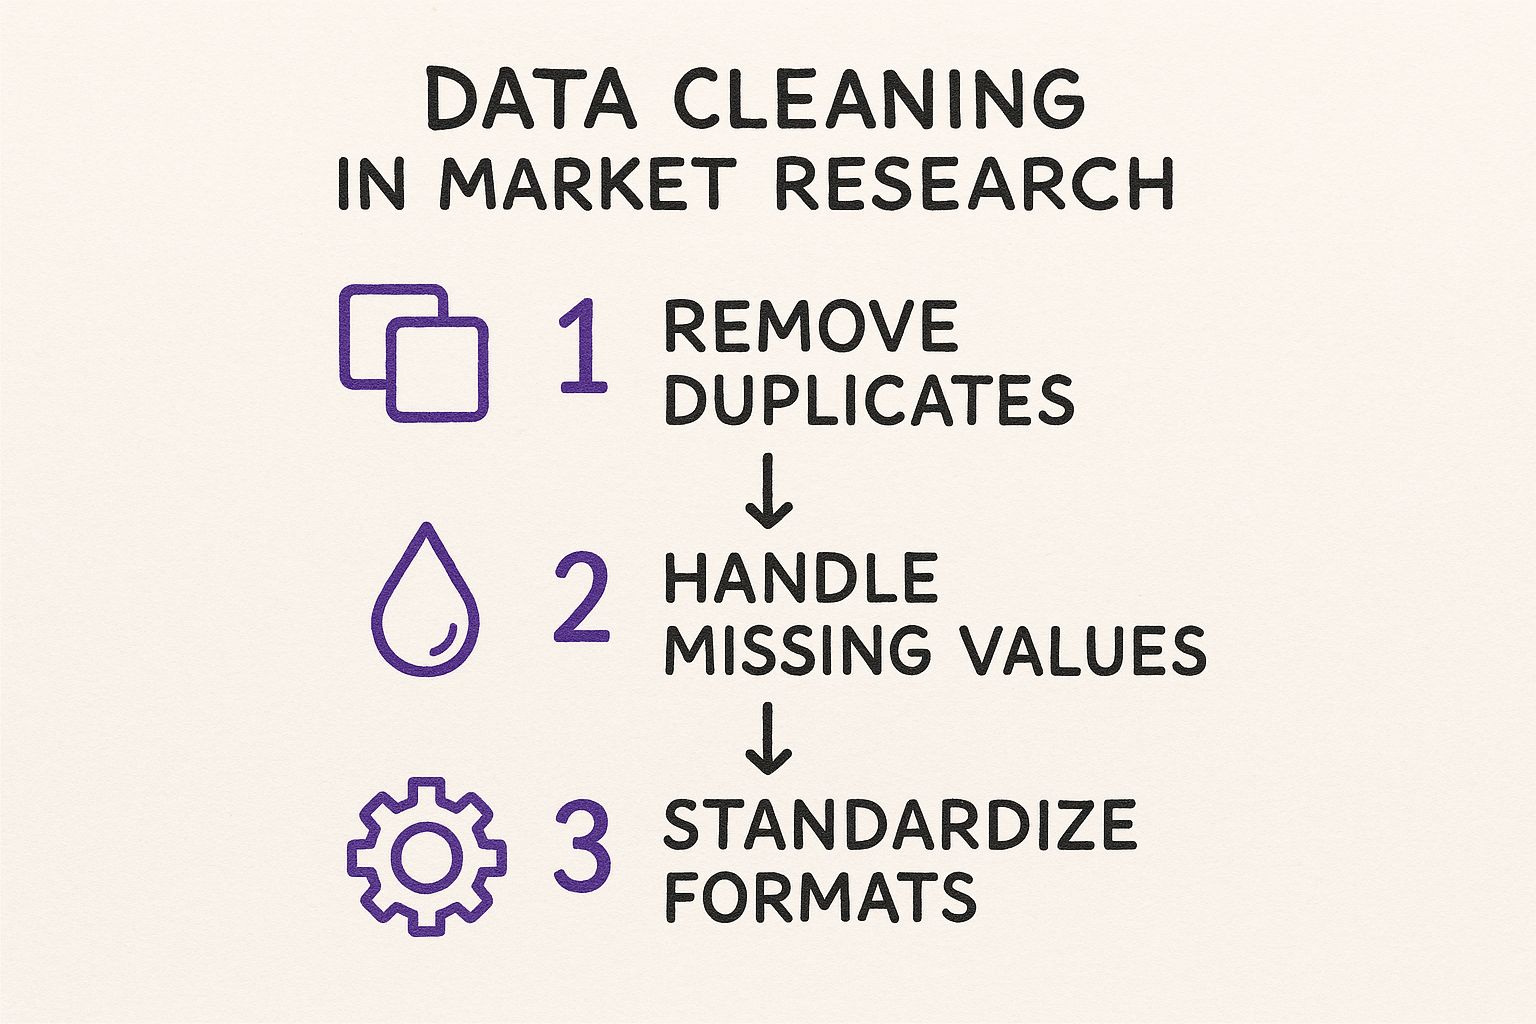
The big takeaway here is that cleaning isn't just one step. It's a process—you zap duplicates, handle blank responses, and standardize terms—that builds a trustworthy foundation for your analysis.
What Actually Happened? The Descriptive Lowdown
First things first. You need to get a handle on the basic facts. This is called descriptive analysis, and it simply answers the question, "What happened?" You're not looking for the why just yet; you're just painting a clear picture of the current situation with the data you have.
Let's imagine you run a fictional cat cafe called "The Purrfect Cup." You recently launched a pricey new "Tuna-tini" for your feline patrons, and sales are… well, a disaster. Your descriptive analysis of customer feedback and sales data might spit out a few key facts:
- A tiny 5% of customers who visited last month bought a Tuna-tini.
- The average satisfaction score for the new drink is a dismal 2.1 out of 5 stars.
- The few people who did buy it were mostly first-time visitors, not your loyal regulars.
This analysis gives you the "what." It doesn't explain why regulars hate the Tuna-tini, but it confirms in black and white that something is definitely wrong. It's your baseline reality check.
Why Did It Happen? Digging Deeper with Diagnostics
Once you know what happened, the next obvious question is... why? This is where diagnostic analysis comes into play. You’re digging a level deeper to find the root cause of the patterns you spotted in the first phase.
To figure out why the Tuna-tini is flopping, you need to connect different pieces of your data. A simple but powerful technique for this is cross-tabulation. It sounds technical, but it’s just a fancy term for comparing two different survey questions in a table to see how they relate. You can pull this off easily in Excel or Google Sheets using Pivot Tables.
For our cat cafe, you might cross-tabulate the question "Did you buy the Tuna-tini?" with "What is your main reason for visiting?"
| Reason for Visiting | Bought Tuna-tini | Did Not Buy Tuna-tini | | :--- | :--- | :--- | | To play with cats | 2% | 98% | | To get coffee/work | 1% | 99% | | To treat my own cat | 25% | 75% |
Boom. There's your insight. The only people even remotely interested are the ones bringing their own cats for a treat. The vast majority of your customers, who are there for the coffee or to cuddle with your resident cats, couldn't care less.
> You’ve just diagnosed the problem: you built a product for a tiny sliver of your audience while completely ignoring what everyone else actually comes for. The "why" is a fundamental mismatch between your product and your main customer base.
This is the real detective work of data analysis—finding those connections that aren't obvious at first glance.
What Might Happen Next? A Glimpse into the Future
Okay, now we're getting a little more strategic. Predictive analysis is all about using your past data to make an educated guess about the future. You’re spotting trends and projecting them forward. While complex AI models can do this on a massive scale, you can apply the basic logic yourself.
Let's stick with The Purrfect Cup. Looking back at your historical data, you notice a few clear patterns:
- Every time you launch a new human-focused novelty drink (like a "Paw-mpkin Spice Latte"), sales jump by 15% for a month.
- Social media engagement goes through the roof when you post photos of your resident cats, not visiting ones.
- Feedback from the "play with cats" crowd consistently mentions wanting more comfortable seating.
Predictive analysis tells you that if you scrapped the Tuna-tini and instead launched a new themed latte while investing in some cozy new armchairs, you would likely see a major boost in both sales and customer happiness. You're using past performance to predict future outcomes.
This is where the real power is. You stop just reacting to problems and start proactively making moves that are far more likely to pay off. You can't see the future, but a solid analysis of your market research is the closest thing you have to a crystal ball. It’s all about making smarter bets.
Using Tools That Make Analysis Easier
https://www.youtube.com/embed/EUeQRE5UJpg
Let's be real. You don't have to do all this with a graphing calculator and a fresh pot of coffee. Manually crunching numbers in a spreadsheet is a recipe for a headache and a strong desire to take up professional napping.
Luckily, some amazing tools out there can do the heavy lifting for you. Think of them as your new best friends—the ones who are actually good at math and don't mind sorting through thousands of survey responses. They can save you a ton of time and, more importantly, your sanity.
The world of market research data analysis is packed with software designed to help you work smarter, not harder. From spotting what your rivals are up to, to making sense of customer feedback, the right tool can turn what feels like a week-long project into an afternoon task.
The Big Guns and Their Price Tags
When you start digging into competitive analysis, you'll inevitably run into the giants like Ahrefs and Semrush. They are incredibly powerful platforms that can give you a firehose of data on your competitors' websites, keywords, and ad strategies. And they are great at what they do.
But let's be blunt—they can be seriously expensive. For a small business or a startup founder, that monthly subscription can feel like a second rent. It's the kind of investment that makes you wonder if you really need to eat this month.
While these tools are fantastic, they aren't your only option. You don't have to sell a kidney to get good insights. For a more accessible approach, a platform like already.dev gives you powerful competitive intelligence without the enterprise-level price tag. You can get a clear picture of the competitive landscape and find opportunities without breaking the bank. Want to get a head start? Our guide on how to do competitor research offers a great framework.
Your New AI Assistant Has Arrived
The real game-changer in modern analysis is artificial intelligence. AI isn't just a buzzword anymore; it's a practical sidekick that can automate the most mind-numbing parts of your job.
> The integration of AI is no longer optional but essential for firms aiming to maintain relevancy. This technology is fundamentally transforming market research by automating repetitive tasks and refining data analysis at incredible speeds.
AI-powered tools can do things that would have sounded like science fiction just a few years ago. They can scan thousands of customer reviews from across the web and summarize the most common praises and complaints in seconds.
Here’s what that looks like in the real world:
- Sentiment Analysis: Instead of manually reading 5,000 customer comments, an AI tool can instantly tell you that 72% are positive, 18% are negative, and 10% are neutral. It might even flag that most of the negative comments are about your shipping times.
- Trend Spotting: AI can analyze sales data alongside social media chatter to spot emerging trends before they become obvious. Maybe it notices a sudden spike in people searching for "vegan cat food" and alerts you to a new market opportunity.
- Data Summarization: Got a 50-page research report? An AI tool can condense it into a one-page summary with the most important takeaways, saving you hours of reading.
This automation frees you from the tedious, manual steps like data entry and basic reporting, allowing you to focus on the fun part: thinking strategically. You can learn more about how automation is reshaping the market research industry and why it's become so crucial.
The best part? You don't need to be a data scientist to use these tools. Many are built with simple, intuitive interfaces where you can describe your goals in plain English. The AI gets to work, generating charts, summaries, and insights that you can actually use to make better decisions. It’s all about finding the right tools that fit your budget and your needs, turning you into a data analysis pro overnight.
Turning Your Insights Into Action

So, you’ve done the hard work. You wrestled with messy data, uncovered the hidden story, and now you have a pile of shiny insights. That’s a huge win! But let's be real—an insight that just sits in a report is completely useless. It's like finding a treasure map and then using it as a coaster.
The whole point of market research data analysis is to do something with what you've learned. This is the moment where all that effort pays off, turning a spreadsheet into a smarter marketing campaign, a better product, or a brilliant new strategy. It’s time to close the loop between your findings and real-world results.
From Data Points to a Compelling Story
Nobody wants to sit through a presentation where you just read bullet points off a slide. You need to tell a story. If your analysis of the fictional "cat cafe" showed that regulars hate your new fancy menu item, don't just state the fact.
Weave it into a narrative. Something like: "Our most loyal customers, the ones who keep our lights on, feel left out by our new menu. While we were chasing a small group of first-timers, we were accidentally pushing our regulars away." See the difference? Suddenly, it’s not just data; it’s a drama with real stakes.
> An insight that doesn't inspire action is just trivia. Your job isn't just to be a data analyst; it's to be a data storyteller who convinces people to make a change.
Build an Action Plan, Not a Bookshelf Report
Once your team is nodding along, you have to avoid the dreaded "analysis paralysis"—where everyone agrees with the findings but nobody does anything. The cure for this is a simple, clear-cut action plan.
For every key insight, define a concrete next step. Turn your findings into a practical to-do list.
- Insight: Loyal customers feel ignored by the new menu.
- Action: Immediately run a survey asking our regulars what they want to see on the menu next.
- Insight: The few people who bought the "Tuna-tini" were actually getting it for their own cats.
- Action: Let's brainstorm three low-cost "pet-friendly treats" we can test out next month.
Set measurable goals to track your success. For example, you could aim to increase your regulars' average spending by 15% within three months of launching a new, customer-inspired menu. This turns your analysis from a one-time project into an ongoing cycle of learning and improving. It's how you make sure your hard work actually moves the needle.
If you need a hand building out the competitive side of your action plan, our framework of competitive analysis can give you a solid structure to follow.
Got Questions? We've Got Answers.
Still have a few things you're mulling over? Good. Let's dig into some of the most common questions people ask when they start analyzing market research data.
How Much Data Is Enough Data?
This is the big one, isn't it? It's the classic "how long is a piece of string?" problem, and frankly, the answer is: it depends.
You don't always need a mountain of data to uncover gold. I've seen startups pivot their entire strategy based on just a handful of incredibly insightful customer interviews. Those can be way more powerful than a generic survey with 10,000 responses.
> The real goal isn't collecting the most data. It's about collecting the right data. Quality will always beat quantity. A small, super-relevant dataset is a hundred times more valuable than a huge, messy one you can't make sense of.
For your quantitative stuff, like surveys, you're looking for statistical significance—enough responses so you can be confident the results aren't a random fluke. But for qualitative work, like one-on-one interviews, you often just go until you hit "saturation," which is the point where you stop hearing brand-new insights.
Isn't This Kind of Analysis Only for Big Companies?
Not a chance. That's one of the biggest misconceptions in the business world. Sure, giant corporations have entire teams dedicated to this, but the tools and strategies are more accessible than ever.
Think about it: a small business owner can learn a ton just by carefully analyzing 50 customer support emails or digging into their free Google Analytics data. The fundamental idea is the same no matter your size: ask smart questions, spot the patterns, and use what you learn to make better decisions. You don't need a massive budget; you just need to be curious.
High-end tools like Ahrefs or Semrush are fantastic but come with a hefty price tag. That’s precisely why platforms like already.dev were created—to give you those critical competitive insights without draining your bank account. Smart analysis is about being resourceful, not just having deep pockets.
Ready to stop guessing and start knowing what your competitors are up to? Already.dev uses AI to do the heavy lifting, delivering a comprehensive competitive analysis in minutes, not weeks. Get started with Already.dev today.