Your Competitive Analysis Template Excel That Actually Works
Tired of confusing spreadsheets? Download our competitive analysis template excel and learn how to quickly find insights that give you a real edge.
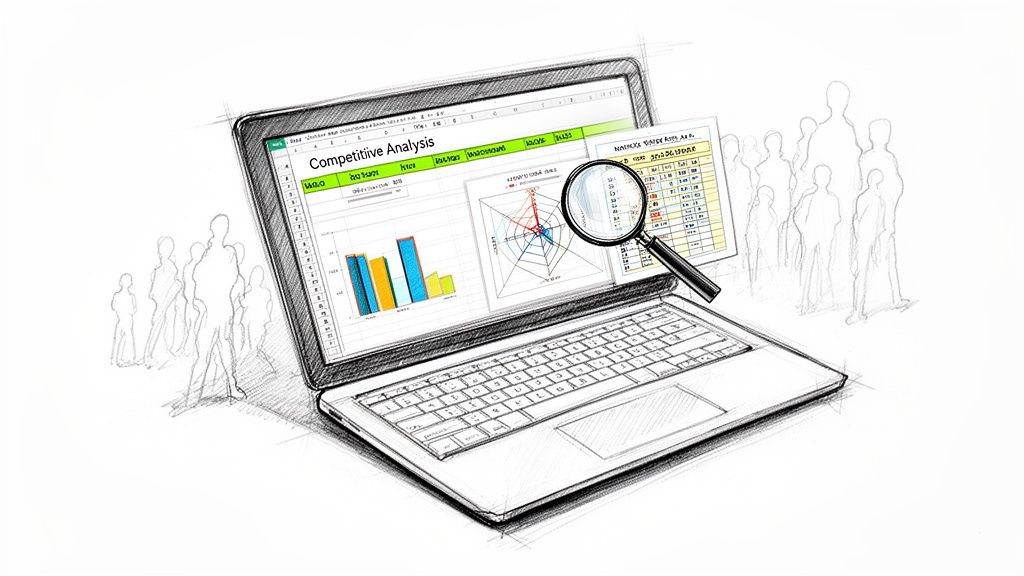
So, you downloaded that free competitive analysis template for Excel expecting a quick win, didn't you? Let's be real—you're probably now buried in a spreadsheet, wrestling with broken formulas, and copy-pasting until your eyes glaze over. It’s the classic story of a simple task somehow morphing into a 40-hour data entry marathon.
Why That Free Template Is Costing You a Fortune
We’ve all been there. You grab a template, excited to finally map out the competitive landscape, only to discover it’s an empty shell. The template is just the box; the real work—the mind-numbing, soul-crushing manual research—is all on you. This isn’t just about losing a weekend; it’s about the very real costs of doing things the hard way.
The issue isn't Excel. It’s that static templates give you a false sense of progress. You spend hours meticulously filling in cells with data that becomes obsolete the second a competitor adjusts their pricing or ships a new feature.
The True Price of Manual Research
Every hour you're bogged down in spreadsheets is an hour you're not talking to customers, refining your product, or actually building your strategy. You effectively become a data entry clerk for your own company. This manual grind leads to some seriously expensive mistakes.
A survey of over 1,200 SaaS product managers uncovered a shocking link between manual analysis and flawed strategy. Teams that spent over 40 hours fighting with basic Excel templates were 35% more likely to miss critical indirect competitors. This blind spot contributed to bad product roadmaps and an average of $250,000 in wasted development costs per startup.
> The biggest risk isn't the competitor you know; it's the one you never see coming because you were too busy updating cell A52. Your template can't warn you about a new player that just raised a seed round or a company in an adjacent market solving your customer's problem in a new way.
Here’s a quick look at why the old spreadsheet method is so painful compared to a more modern process.
The Manual Excel Grind vs The Smart Approach
| Task | Manual Excel Method (The Grind) | An Automated Approach Like Already.dev | | :--- | :--- | :--- | | Data Collection | Hours or days of manual web scraping, copy-pasting pricing, and feature lists. | Finds competitors and pulls their data automatically in minutes. | | Data Accuracy | Instantly outdated. A price change means your entire analysis is wrong. | Data is refreshed automatically, so your insights are always current. | | Competitor Discovery| You only track who you already know. High risk of missing new threats. | Discovers direct and indirect competitors you didn't even know you had. | | Strategic Focus | 90% of your time is spent on data entry, 10% on actual analysis. | 10% of your time is on setup, 90% is on making strategic decisions. | | Cost | "Free" template, but costs hundreds of hours in lost productivity. | Low subscription cost that pays for itself by saving one person's time. |
The takeaway is clear: the manual process is slow, expensive, and dangerously incomplete. You might spend days collecting information only to make a decision based on a snapshot that’s already old news.
Beyond the Spreadsheet Nightmare
So, what’s the alternative?
While powerful market research platforms like Ahrefs or Semrush are fantastic, they're often overkill and can be expensive for a startup or PM who just needs the core competitive data. A better approach is to automate the data collection itself. Tools like Already.dev are built to do the heavy lifting for you—finding direct and indirect competitors and pulling in the key data points automatically. This frees you up to focus on analysis, not administration.
If you're ready to level up your data analysis tools from Excel to AI without blowing up your existing workflows, it's a great next step.
Don't worry, we're still going to give you the free template you came for. But we're also going to show you how to use it without wanting to throw your laptop out the window. For more on this, check out our guide on finding the right https://blog.already.dev/posts/competitor-analysis-template-free. This is all about helping you make smarter, faster decisions.
Finding Your Competitors Without Losing Your Mind
Alright, you've got your shiny new Excel template open. Now for the "fun" part—actually finding competitors to fill it with.
Look, if your plan is to just Google your main keyword and list the top three results, you might as well stop now. Seriously. You'll get more strategic value from watching cat videos on YouTube.
The real goal isn't just to find the obvious giants everyone knows. It’s to uncover those scrappy upstarts, the niche players, and the indirect rivals who are quietly stealing your customers. This is your game plan for digging up the competitors that actually matter.
Before you get lost in the manual grind, let's be real about the workflow you're about to face.
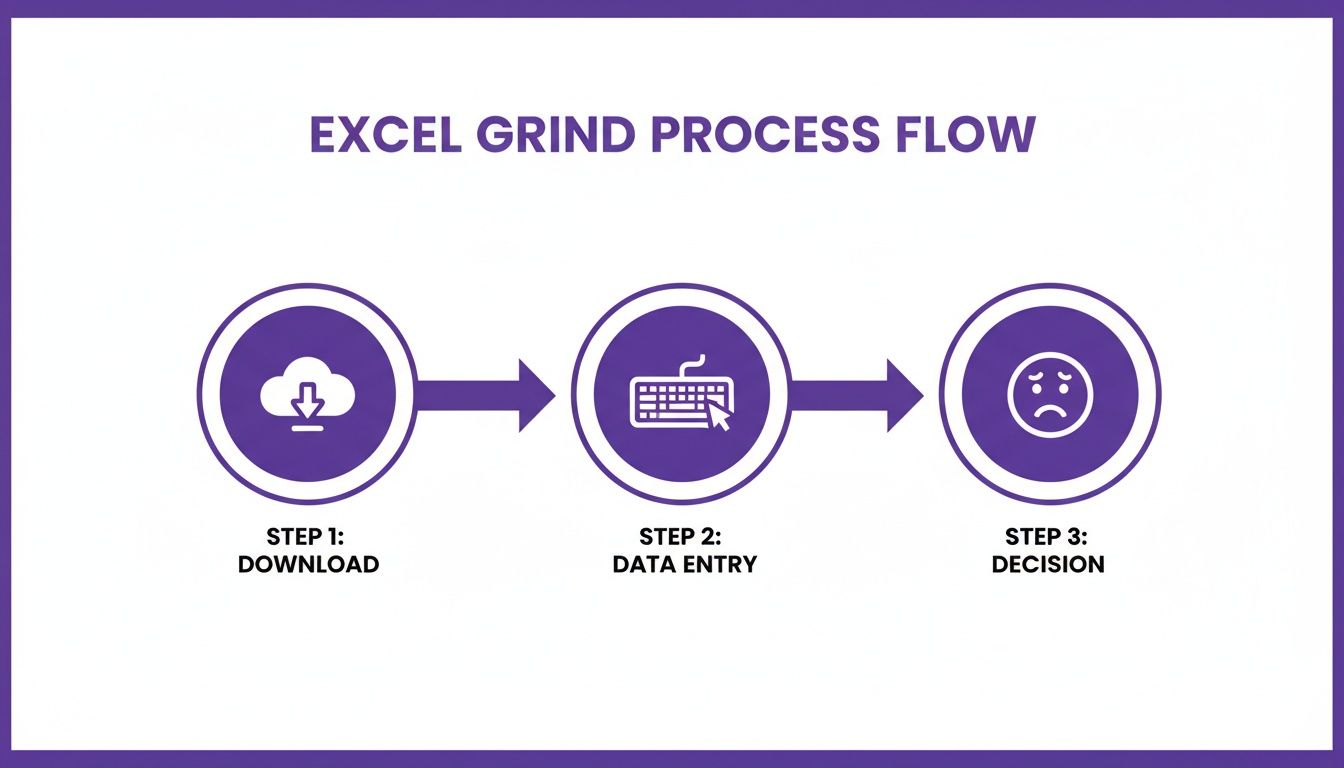
This simple loop—downloading a template, painstakingly entering data, and then trying to make sense of it all—is where most people get stuck. Let's make sure that doesn't happen to you.
Go Beyond the First Page of Google
Your most dangerous competitors are often the ones who haven’t mastered SEO yet but have a killer product that people are already buzzing about. To find them, you need to think like a frustrated customer desperately searching for a solution.
Here are a few goldmines for competitor discovery that I always turn to:
- "Alternative To" Websites: I'm talking about sites like G2, Capterra, and even Product Hunt. They are fantastic resources. Just search for a well-known competitor, and you'll get a curated list of alternatives that real users are actively considering. This is some of the lowest-hanging fruit you'll find.
- Niche Subreddits and Forums: Where does your target audience hang out online? Is there a subreddit for them? People in these communities complain, ask for recommendations, and mention the tools they're using. A quick search for "how do you solve [problem]" can reveal competitors you never even knew existed.
- Customer Review Sections: Go to the review pages for your biggest competitors on sites like Trustpilot. The real gold is in the one- and two-star reviews. People will often write things like, "I'm switching to [Competitor X] because their support doesn't ghost me." Boom, a new competitor just landed on your list.
Once you start digging, you'll have a long list of potential rivals. Don't try to analyze all of them. Narrow it down to the top 3-5 direct competitors who are clearly going after the same audience with a very similar solution.
> Pro Tip: Don't just look for direct competitors. An indirect competitor solves the same core problem but with a totally different approach. For instance, if you sell project management software, an indirect competitor could be a souped-up spreadsheet template or even a simple to-do list app. They're still solving the same pain point.
What Data Should You Grab First?
Your Excel template is hungry for data, but don't just copy-paste everything from their homepage. You'll get overwhelmed fast. Focus on the essentials first.
Start by grabbing these key data points for each competitor:
- Core Features: What are the main things their product actually does? Don't list every single bell and whistle. Just grab the top 3-5 features they highlight on their homepage.
- Pricing Tricks: What's their pricing model? Is it a subscription, a one-time fee, or something else? Do they have a free plan? What are the key limitations on each tier? This tells you exactly who they're trying to attract.
- Target Audience: Who are they talking to in their marketing copy? Is it "startups," "enterprises," or "freelance creatives"? Their language reveals their ideal customer profile.
Gathering this information is tedious work. That’s where big, expensive SEO tools like Ahrefs or Semrush usually come in. They can give you a mountain of data, but they often cost a fortune and provide way more information than you need at this early stage. A more focused (and affordable) alternative is a tool like Already.dev, which is built to automate this discovery process. It’s designed to find both direct and indirect competitors and pull the critical data for you, saving you from that manual grind.
Once you've identified your rivals, it's crucial to follow a structured approach. This step-by-step guide to competitive analysis provides a solid framework for turning all that raw data into real, actionable insights. That's how you build a competitive analysis that actually helps you make smarter decisions.
How To Analyze Competitor Pricing and Not Undersell Your Product
Pricing is where good startups go to die. It's that simple. Just adding a 'Price' column to your competitive analysis template for Excel is a rookie move—like bringing a water pistol to a firefight. You’re setting yourself up to either get bulldozed by the competition or leave a ton of money on the table.
Let’s be honest, analyzing what your competitors really charge is a messy, confusing job. We're going to dive deep and move beyond the shiny sticker price on their homepage. The real story is always hidden in the details.
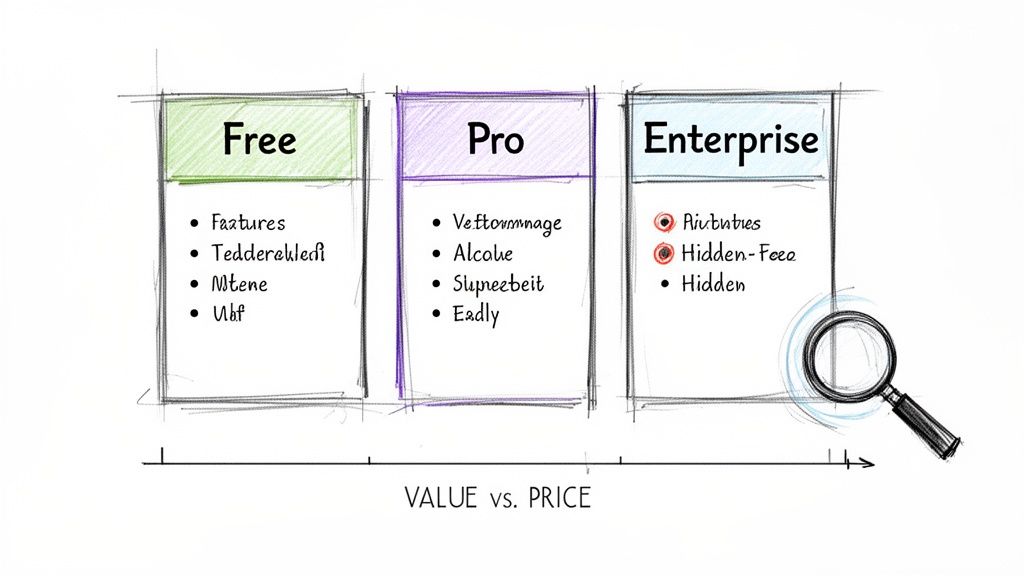
Uncovering the Real Cost
The number on a pricing page is just the beginning. The goal is to figure out the total cost of value. What does a customer actually get for their money, and where do they get nickel-and-dimed?
Here’s what you need to hunt for:
- Feature Limitations on Free Plans: What crippling limitations make their "free" tier almost unusable for a serious customer? Do they limit users, projects, or core functionality? This is often a clue to what they consider their most valuable feature.
- Hidden Fees and Add-ons: Look for charges related to setup, support, or extra integrations. That "$49/month" plan can quickly balloon to over $100 when you factor in the "essentials."
- Tier Structure: How do they guide customers from one plan to the next? What's the big jump in value between their "Pro" and "Business" tiers? This structure reveals their entire upselling strategy.
By mapping this out, you start to see the psychology behind their pricing. You’re not just comparing numbers; you’re comparing value propositions.
Simple Excel Tricks for Pricing Analysis
Once you have this data, your Excel template can become a powerful tool. You don't need to be a spreadsheet wizard. A few simple formulas can tell a compelling story.
Let's say you're comparing three competitors with different pricing models—one per user, one with feature tiers, and one with usage-based pricing. It's an apples-to-oranges-to-bananas comparison.
You can create a "Cost for a 10-Person Team" column. For the per-user competitor, the formula is simple: =price * 10. For the tiered competitor, you'd use a simple IF statement to see which tier a 10-person team falls into. This normalizes the data, giving you a true side-by-side view.
> The goal isn't just to see who is cheaper. It’s to understand where you fit. Are you the premium, all-inclusive option? The budget-friendly choice for small teams? Your pricing tells a story about your brand.
The Biggest Flaw with Manual Pricing Analysis
Here's the brutal truth: this pricing data goes stale faster than a loaf of bread in the desert. Research shows this is a huge problem for product teams. Historical data from 2020-2025 reveals that while businesses using competitive analysis Excel templates cut pricing mistakes by 27%, a staggering 65% of teams reported that their data was outdated within just two weeks due to competitor flash sales or sudden tier changes.
A competitor could change their pricing tomorrow morning, and your entire beautiful spreadsheet would be wrong. Manually checking ten pricing pages every day is not a strategy; it's a punishment. This is where you have to think about automation.
Staying Current Without Losing Your Sanity
This is exactly why tools that monitor the market in real-time exist. While big platforms like Ahrefs or Semrush can be incredibly powerful, they're also notoriously expensive and often provide more data than you actually need for pricing analysis alone.
A more focused approach is to use a service like Already.dev, which is designed to automate the painful parts of competitive research. It keeps an eye on your competitors' pricing pages, feature lists, and marketing messages for you. When a rival changes their tiers or launches a new discount, you know about it instantly—not two months later when you're wondering why your sales have dipped. This turns your static Excel template into a dynamic, strategic asset.
To learn more about the nuances of this process, check out our deep dive into tracking competitor pricing data. It will help you build a system that keeps you ahead of the game, ensuring you never undersell your product again.
Bringing Your Data to Life with a Visual Dashboard
A spreadsheet crammed with data is where good insights go to die. Seriously, no one wants to squint at a wall of text and numbers to figure out what’s actually going on. It’s time to stop torturing your team (and your investors) and turn that data dump into something they can understand in five seconds flat.
This isn't about making a few generic pie charts. It's about building a visual story that exposes market gaps and practically screams, "Hey, build this next!" Let's get into how to build these dashboards right inside your competitive analysis template excel.
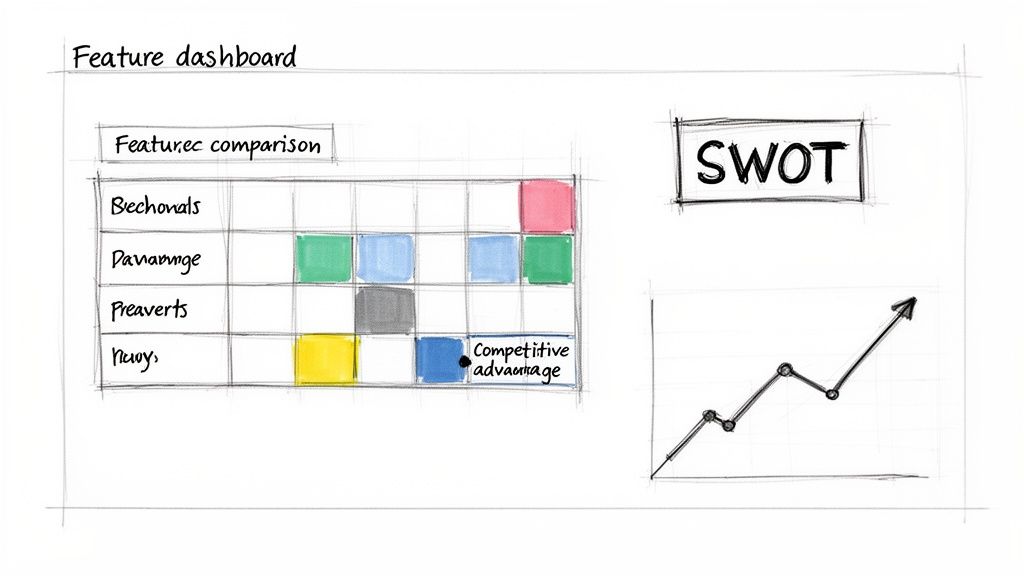
Nail the Feature Comparison Grid
First things first: the feature grid. Think of this as your battlefield map, showing you exactly where you win, lose, or are just holding your own against the competition, feature by feature. It’s surprisingly simple to build and delivers a ton of clarity almost instantly.
Just start with a basic table. List your most important features down the first column. Then, across the top row, put your company and your top 3-5 competitors. From there, you just fill in the cells with a simple system:
- "Yes": The feature is there.
- "No": They don't have it.
- "Partial": It sort of exists, but it’s limited or poorly implemented.
But let's be real, text is boring. This is where a little Excel magic comes in. Select your grid, navigate to Conditional Formatting > Color Scales, and pick a green-to-red scale. Just like that, "Yes" cells can be green, "No" cells red. Suddenly, you can see who’s leading the pack and where your biggest opportunities are at a glance.
> The goal here isn't just to have more "Yes" boxes than everyone else. It's to spot the patterns. Are all your competitors missing a key feature your customers are constantly asking for? That's not just a blank spot on a chart; that's your next big product move.
Your Visuals: From Grids to Graphs
To really tell a compelling story, you need more than one visual. A good dashboard combines a few key charts and grids to give you a 360-degree view of the market. Here are the essentials I always include.
| Visual Component | What It Shows You | Quick Excel Tip | | :--- | :--- | :--- | | Feature Comparison Grid | A direct, side-by-side view of feature parity. | Use Conditional Formatting with color scales (Green/Yellow/Red) to make feature gaps pop. | | SWOT Analysis | Translates your data into strategic Strengths, Weaknesses, Opportunities, and Threats. | Create four separate text boxes or merged cells. It’s a qualitative tool, so keep it high-level. | | Pricing Tier Chart | Maps out competitor pricing plans against the features they offer at each level. | Use a Scatter or Bubble chart. Plot price on the Y-axis and number of features on the X-axis. | | Go-to-Market Matrix | Compares how competitors acquire customers (e.g., SEO, Paid, PLG). | A simple table is all you need. This visualizes channel saturation and identifies untapped channels. |
These components work together to move your analysis from a simple data collection exercise to a strategic planning tool. The grid tells you what exists, and the SWOT and GTM matrix help you figure out so what?
The Five-Minute SWOT
Next up is a quick SWOT analysis—Strengths, Weaknesses, Opportunities, and Threats. Don't overcomplicate this. We're not writing a business school thesis; we're creating a practical tool for quick decisions.
Just create four big boxes in a new tab on your sheet and label them. Then, using your feature grid and pricing data, start jotting down notes:
- Strengths: Where are you dominant? What unique features do you have? Is your pricing way simpler?
- Weaknesses: Where are you lagging? Missing a key integration everyone else has?
- Opportunities: What features are missing across the board? Is there an underserved customer niche?
- Threats: Is a competitor raising a massive funding round? Are they in a price war?
This simple exercise forces you to connect the dots. You're no longer just looking at data points; you're building a strategic narrative.
Mapping Out Go-to-Market Strategies
Finally, let's get a handle on how your competitors are actually getting in front of customers. Understanding this can help you find overlooked channels that could become your secret weapon.
All you need is another straightforward table:
| Competitor | Primary Marketing Channel | Secondary Channel | Key Messaging Angle | | :--- | :--- | :--- | :--- | | Competitor A | SEO & Content Marketing | Paid Social (LinkedIn) | "The Enterprise Solution" | | Competitor B | Product-Led Growth (Free Trial) | Community (Slack) | "Simple for Small Teams" | | You | ??? | ??? | ??? |
A table like this makes it immediately obvious who owns which space. If everyone is duking it out over the same SEO keywords, maybe your time is better spent building a killer community or owning a different social platform. It helps you play chess while they're playing checkers.
The Problem with Manual Dashboards
Okay, so building these visuals is a huge leap forward from a plain old spreadsheet. An analysis of 800 startups actually found that those using visual competitive matrix templates identified 40% more market opportunities.
But that same study uncovered a painful truth: it still took them an average of 25 hours to build and populate these templates. Even worse, 52% of them failed to keep the data current when competitors launched new features or changed pricing.
Herein lies the big catch with any manual approach. Your beautiful, insightful dashboard is a static snapshot in time. It's incredibly valuable the day you create it, but its accuracy starts to decay almost immediately.
This is where automated platforms can be a game-changer. While powerhouse tools like Ahrefs or Semrush are great, they can also be incredibly expensive and complex. A more modern tool like Already.dev is built specifically for this—it automates the data gathering and visualization for you. It builds these kinds of dashboards on your behalf and, more importantly, keeps them fresh, giving you all the clarity without the soul-crushing manual upkeep.
Turning Your Data Into Winning Decisions
Alright, you did it. You’ve wrestled with Excel and come out on top. Your competitive analysis spreadsheet is a glorious tapestry of data, color-coding, and maybe even a few slick-looking charts. It’s a thing of beauty.
So… now what?
Let’s be honest: a spreadsheet packed with information is, by itself, just a really complicated document. Information without action is just noise. This next part is where all that hard work really starts to pay off—turning that data into a concrete game plan.
From Data Points to Action Items
Your analysis is practically screaming clues at you. The trick is knowing how to translate them. Instead of getting bogged down in the sheer volume of data, try thinking in simple "if-then" scenarios. This approach cuts straight through the complexity and turns your findings into a practical to-do list.
-
If… your feature grid has a massive green column under your name for "AI-powered summaries," a feature none of your competitors offer.
-
Then… your next marketing push shouldn't just mention AI. It should be the star of the show. Make it the hero of your homepage and every ad you run.
-
If… your pricing chart shows every single competitor uses a confusing, multi-tiered subscription model that feels designed by a committee.
-
Then… you have a golden opportunity to win with simplicity. A single, transparent price could become your most powerful differentiator.
This isn’t rocket science; it's about connecting the dots. Your competitive analysis template excel isn't just a bucket for data; it's an engine for making smarter decisions.
> The most dangerous thing you can do after finishing a competitive analysis is to file it away. Treat it like a living document, not a homework assignment you just turned in. It's your strategic playbook.
Sharpening Your Product Roadmap
One of the best ways to use your analysis is to sanity-check your product roadmap. We all have a list of features we think we should build, often based on our own gut feelings or that one really loud customer. Your spreadsheet is here to replace that guesswork with cold, hard evidence.
Let's say your analysis uncovers a major feature gap. Every single one of your top competitors has a Slack integration, and you don’t. The knee-jerk reaction? Panic and immediately pull half your engineering team into a meeting to start building it.
But hold on. Before you do that, you need to validate it. The analysis gave you the "what," but you still need to find the "why."
- Talk to Your Customers: Go to your best, most loyal users and ask, "We've noticed competitors have a Slack integration. Is that something you'd actually use? How would it make your life easier?"
- Talk to Churned Users: Reach out to people who canceled and ask point-blank, "Was the lack of a Slack integration a factor in your decision to leave?" Their honesty might surprise you.
- Gauge the Effort: Now, go to your engineers. Is this a two-week project or a six-month technical nightmare?
The analysis points you in the right direction, but it's those customer conversations that confirm if the journey is worth taking.
Finding Your Marketing Angle
Your analysis is also a goldmine for your marketing team. Once you've mapped out your competitors' messaging, you can easily spot the crowded conversations and find the wide-open lanes where your voice can be heard.
Imagine every competitor's website is plastered with the same phrases: "easy to use" and "simple." The market is totally saturated with that message. Instead of just adding to the noise, your analysis might show that while they all claim simplicity, their customer reviews are filled with complaints about nonexistent customer support.
Bingo. That's your angle.
You can build an entire marketing strategy around being "The Simple Tool with Human Support That Actually Answers the Phone." You’re not just making a random claim; you’re directly addressing a market-wide weakness your analysis uncovered. This is how you turn a single data point into a message that truly resonates and wins customers. Your spreadsheet just handed you the keys.
Quick Answers to Common Competitive Analysis Questions
Alright, let's tackle some of the questions that always come up when you're deep in the trenches with a competitive analysis spreadsheet. Think of this as your go-to guide for navigating the tricky parts.
How Often Should I Update This Thing?
This is the million-dollar question. The honest, and maybe slightly frustrating, answer is... it depends. If your spreadsheet is packed with fast-moving data like social media stats or daily pricing changes, it's pretty much stale by tomorrow. But for bigger-picture items like core product features or target markets, you've got more leeway.
Here’s a practical rhythm I've found works well:
- Quarterly: This is for your deep-dive refresh. It’s the perfect time to re-evaluate your top 3-5 competitors, scout for any new challengers entering the scene, and give your SWOT analysis a serious update.
- Monthly: Do a quick pulse check on the most critical metrics. For most businesses, this means pricing. You absolutely need to know if a competitor just dropped a new, cheaper plan that could steal your customers.
- Continuously: Always keep an ear to the ground. Simple Google Alerts or a quick scan of industry news can be incredibly revealing. When a rival lands a huge funding round, that’s a massive signal that the game is about to change.
What If I Can’t Find Good Data?
It’s one thing to analyze a big public company with tons of information available, but what about that stealthy startup that's suddenly eating your lunch? Sometimes, the data you need just isn't sitting on their homepage. This is when you have to put on your detective hat.
Forget what they say about themselves; find out what their customers are saying.
> Go dig through review sites, Reddit threads, and Twitter mentions. You’ll often uncover brutally honest feedback on their product gaps, pricing complaints, and support issues—gold you'd never find in their polished marketing materials.
Are Paid Tools Actually Worth The Money?
For certain tasks, they absolutely are. Tools like Ahrefs or Semrush are powerhouses for deep SEO and content analysis, but let's be real—they come with a hefty price tag. For a lot of startups, it's just overkill.
The true magic of a paid tool is automation, especially for data that gets old fast. Instead of manually checking a dozen pricing pages every week, a service like Already.dev can handle that grunt work for you. It puts the painful data collection on autopilot so you can focus on strategy, which is the whole point of this exercise. A great tool doesn't just hand you data; it hands you back your time.
Ready to ditch the manual grind and get competitive insights that are always fresh? Already.dev automates the entire research process, from discovering competitors to tracking their every move. Get your free analysis today and see what you've been missing.