How Do You Calculate Share of Voice? A Simple, No-Nonsense Guide
Learn how do you calculate share of voice with our easy guide. Discover simple steps, tools, and examples to measure your brand's visibility effectively.

So, how do you actually calculate your share of voice? It’s way less complicated than it sounds. You just take your brand’s performance on something, divide it by the total market's performance for that same thing, and multiply by 100.
That’s it. The classic formula is (Your Brand Metrics ÷ Total Market Metrics) × 100. This gives you a simple percentage that shows how much of the conversation you own, whether it's on social media, Google, or anywhere else.
What Exactly Is Share of Voice, Anyway?

Before we start crunching numbers, let's get on the same page. Share of Voice (SOV) is really just a fancy way of asking, "How much of the spotlight is on us?"
Think of your industry as a huge, noisy party. Are you the one in the middle of the room, captivating everyone with great stories? Or are you the one lingering by the snacks, hoping someone will notice you? That's SOV in a nutshell. It’s a measure of your brand’s visibility against your competitors. It's not just some vanity metric to flash in a meeting; it's a compass pointing to exactly where you stand.
To get you started, here's a quick cheat sheet.
Your SOV Quick Start Guide
| Concept | What It Really Means | The Bottom Line | | :--- | :--- | :--- | | Share of Voice (SOV) | A percentage showing your brand's visibility compared to your competitors in a specific channel. | It tells you who's winning the popularity contest. | | Why It Matters | Helps you gauge market dominance, track competitor activity, and see if your marketing is actually working. | It's a reality check. You can't improve what you don't measure. | | The Basic Formula | (Your Brand Metrics ÷ Total Market Metrics) × 100 | A simple calculation to find out how big your slice of the pie is. |
This table should give you a solid foundation. Now, let's dig a little deeper into why this metric is so crucial.
Why It Matters More Than You Think
Knowing your SOV gives you a shockingly clear picture of the competitive field. A high SOV often goes hand-in-hand with higher market share, stronger brand authority, and more customer trust. It’s your gut check. You might feel like you’re crushing it, but the data will tell you the real story about who’s truly dominating the conversation.
The beauty of this metric is its flexibility. The basic formula for calculating Share of Voice has been a reliable benchmark since brands first started measuring their online footprint. Experts like those at Brandwatch have been tracking this for years, and they confirm its timeless, straightforward math.
> Key Takeaway: Share of Voice isn't about being the loudest; it's about being the one who gets heard. It measures your presence and shows you where your biggest opportunities—and threats—are hiding in plain sight.
Ditching The Jargon For A Second
Let's try a simple analogy. Imagine you and your competitors are running food trucks at a massive music festival. Your Share of Voice is the percentage of festival-goers lining up at your truck compared to all the food trucks combined. It’s a direct measure of who’s winning the battle for hungry customers.
Tracking this helps you answer some pretty critical questions:
- Are my marketing campaigns actually making a dent?
- Which competitor is gaining traction and potentially stealing our customers?
- Are there channels we're ignoring where our competition is weak?
Getting a handle on this is the first step. Once you know where you stand, you can build a smarter strategy to grab a bigger piece of the pie. It’s less about shouting and more about connecting with the right people in the right places.
Breaking Down the Different Flavors of SOV

Thinking "Share of Voice" is just one number is a classic rookie mistake. It's not that simple. The "voice" you're trying to measure totally depends on where you're listening. Your brand could be crushing it on Instagram but be a ghost on Google's search results.
That's why you have to slice and dice your SOV. Knowing where you’re making noise and where you’re being drowned out is the key to a marketing strategy that actually works. Let’s get into the main types you should be tracking.
Organic SOV: Winning the Google Popularity Contest
This is your bread and butter. Organic Share of Voice is all about how visible you are in search engine results—the stuff you don't pay for directly. It answers the simple question: "When people search for keywords that matter to my business, how often do we pop up?"
A high organic SOV means your SEO game is strong. Your content hits the mark, search engines see you as an authority, and you’re giving people what they want. A low score? Well, that means your competitors are eating your lunch, scooping up all that valuable search traffic. Think of it as your brand's natural gravity in the search world.
> Pro Tip: Don't get tunnel vision tracking just one or two golden keywords. You'll get a much more accurate picture of your organic SOV by monitoring a whole basket of terms that your customers are really typing into Google.
Paid SOV: Buying Your Way to the Front Row
Next up is Paid SOV, which is all about your slice of the paid advertising pie. We're talking Google Ads, paid social campaigns—anywhere you're spending money to be seen. This is often called Impression Share in the ad platforms themselves.
Basically, it tells you what percentage of the available ad impressions you're actually capturing compared to everyone else bidding on the same stuff.
If your Paid SOV is 80%, your ads are showing up for eight out of every ten possible chances. Awesome. But if it's a measly 10%, you’re getting outbid or outmaneuvered by the competition almost every time. This metric is the ultimate reality check on whether your ad budget is pulling its weight.
Social SOV: Who Owns the Online Conversation?
Finally, we have Social SOV. This tracks who is dominating the chatter on platforms like X, Instagram, and LinkedIn. It’s all about measuring brand mentions, hashtag use, and the general buzz around your name. Are people talking about you, to you, or is your competitor’s latest launch all anyone can talk about?
This is where you can actually see brand affinity and community engagement come to life. There's a ton of data showing a direct link between social buzz and real-world growth. For instance, in competitive markets like consumer electronics, the top brands often hold a 25-35% SOV on social media, which maps directly to their market share gains. You can dive deeper into these kinds of market insights on HubSpot.
To get the full picture, you really need to look at all these areas together. Maybe your SEO is lagging, but your paid campaigns are killing it. That insight alone tells you exactly where to put your focus next. The first step is getting the data, and a huge part of that is learning how to do competitor research the right way.
While big, expensive platforms like Ahrefs or Semrush can track all this, you can get a lot of this competitive insight from more focused tools like already.dev, which gives you a clear view of the landscape without the hefty enterprise price tag.
How to Calculate Share of Voice for SEO
Alright, let's roll up our sleeves and get into the nitty-gritty. This is where you figure out your actual SEO Share of Voice without needing a degree in data science. It’s less about mind-bending formulas and more about some smart, focused detective work.
The whole thing really comes down to two key pieces: figuring out who you’re really competing against in the search results and which keywords actually move the needle for your business. Once you’ve nailed those, the rest is just connecting the dots.
Identifying Your True Competitors and Keywords
First things first, you need to rethink who your competitors are. Your biggest business rival down the street might not be your biggest SEO threat. In the digital world, you're up against anyone and everyone ranking for the keywords you want to own. This could be a massive publication, a tiny niche blog, or even a random Quora thread that’s somehow snagged a top spot.
Your real job is to pinpoint the websites that consistently pop up on the first page for your most important keywords. These are your digital rivals.
Next, you need a solid keyword list. Don't just pull them out of thin air. Put yourself in your customer's shoes. What are they typing into Google to find a solution you provide? Kick things off with a core list of 5-10 "money" keywords—the ones directly tied to a purchase or inquiry.
Let's say you're a local bakery in Austin. You might track terms like:
- "best birthday cakes Austin"
- "custom wedding cakes near me"
- "sourdough bread Austin Texas"
- "vegan bakery Austin"
- "gluten-free cupcakes Austin"
This tight, focused list is your battlefield. It gives you a clear, manageable scope for your calculation. You're not trying to measure your visibility across the entire internet, just for the searches that actually bring in customers.
Gathering the Right Data
Now that you've got your list of keywords and digital competitors, it's time to collect some data. The two main metrics you absolutely need are search volume (how many people search for a keyword each month) and your ranking position for that keyword.
You'll also need the estimated click-through rate (CTR) for each position on Google. It’s no secret that ranking #1 gets the lion's share of clicks (around 27-30%), while dropping to #10 might only get you 2%. Don't sweat trying to guess these numbers; you can find plenty of reliable CTR studies online to use as a benchmark.
> The Goal: To figure out how much of the total potential organic traffic from your target keywords is landing on your site versus your competitors'. It’s all about estimating your slice of the traffic pie.
This simple infographic gives you a great high-level view of the share of voice formula.
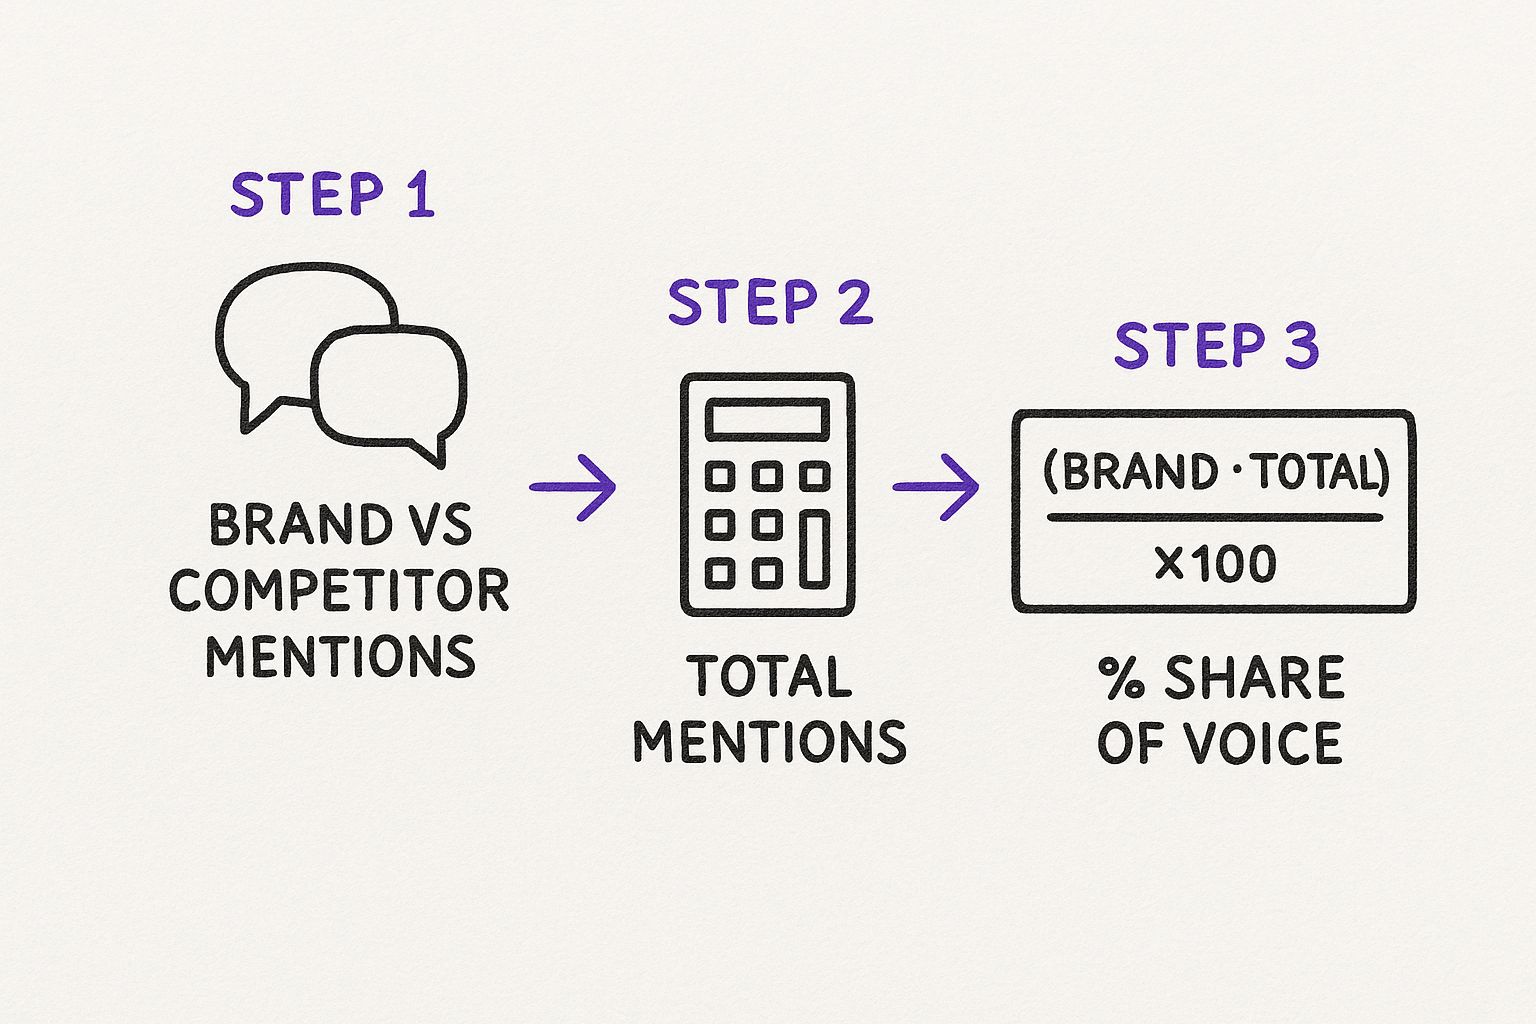
As you can see, the core idea is pretty straightforward: you’re just comparing your brand’s visibility to the total visibility to find your percentage.
A Worked Example: The Local Bakery
Let's stick with our Austin bakery. Imagine they’re tracking those five keywords. To calculate their SOV, they just need to set up a simple spreadsheet to map out their estimated traffic for each one.
Here’s how the math breaks down, step-by-step:
- List Your Keywords: Put your five target keywords in the first column.
- Add Search Volume: In the next column, plug in the monthly search volume for each keyword.
- Find Your Ranking: Jot down your current Google ranking for each term in the third column.
- Estimate CTR: Based on your ranking, add the estimated click-through rate in the fourth column.
- Calculate Your Traffic: Now, just multiply the search volume by the CTR percentage. This number is your estimated monthly organic traffic for that one keyword.
Tally this up for all your target keywords, and the total is your Estimated Organic Traffic.
Finally, you just have to repeat this exact process for each of your main SEO competitors. Once you have the estimated traffic for yourself and everyone else on your list, you can calculate your SOV with one last bit of simple math:
(Your Total Estimated Traffic / Grand Total Estimated Traffic for All Competitors) x 100
And there you have it. That final number is your SEO Share of Voice. It’s a powerful metric that gives you a clear, honest picture of how visible you really are in the search results that matter most.
Essential Tools for Tracking Share of Voice
Manually pulling all this data can be a real grind, especially as your keyword list grows. Thankfully, there are some fantastic tools out there that can do the heavy lifting for you. Here’s a quick look at a few of my go-tos.
| Tool | Best For | Price Point | | :--- | :--- | :--- | | Ahrefs | All-around SEO powerhouse for deep competitor analysis and rank tracking. | Expensive (Starts at $99/mo) | | Semrush | Excellent for keyword research, market analysis, and comprehensive SOV reporting. | Expensive (Starts at $129.95/mo) | | Moz Pro | Great for tracking local SEO and has a very user-friendly interface. | Premium (Starts at $99/mo) | | SERPWatcher | A more affordable, dedicated rank tracker that's simple and effective. | Budget-friendly (Starts at $49/mo) | | already.dev | Smart, focused competitive intelligence for SEO without the bloat. | Accessible |
Whether you go with a do-it-all suite like Ahrefs or a more focused tool like already.dev, automating this process will save you a ton of time and give you much more accurate data to work with.
Choosing Your Tools Without Breaking the Bank

Let's be honest, you can't calculate share of voice with a crystal ball and a spreadsheet full of wishful thinking. You need real data, and for that, you need tools. The good news? You don't have to mortgage your house to get them.
The market is flooded with software promising the world, but many come with a price tag that will make your eyes water. So, let’s talk about getting the insights you need without your finance team staging an intervention.
The Big Guns (and Their Big Bills)
You've probably heard the names—heavy-hitters like Ahrefs and Semrush. They're phenomenal, feature-rich platforms that can tell you practically everything you’d ever want to know about your competition. But let's not beat around the bush: they can be absurdly expensive. For a startup or a small business, a subscription running hundreds of dollars every month is often a non-starter.
These enterprise-level tools are fantastic if you have a dedicated SEO team and a budget to match. For everyone else, it’s a bit like buying a Lamborghini for your weekly grocery run—impressive, but complete overkill.
> My Two Cents: Don't get distracted by a million features you'll never touch. You need to focus on the core data for calculating SEO share of voice: keyword rankings, search volume, and competitor visibility. That’s the magic trio.
Smarter, Scrappier Alternatives
This is where you can get clever and outmaneuver the competition. Instead of just picking the most famous (and most expensive) tool, look for options that do the important stuff really, really well, without all the extra fluff.
Here are a few ways to build a smart, budget-friendly toolkit:
-
For SEO SOV: A platform like already.dev is a perfect example of this approach. It’s designed specifically for competitive intelligence, so it cuts straight to the chase. You get the essential keyword and visibility data you need to calculate your share of voice, minus the enterprise-level cost. It gives you a clear picture of exactly where you and your rivals stand in the search results.
-
For Social SOV: Sometimes, the best tools are the ones you’re already using. You can pull a surprising amount of data by just doing some manual digging on social media. Search for mentions of your brand, your competitors, and key industry hashtags. It’s not automated, but it’s completely free.
-
For Media Mentions: Your new best friend is Google Alerts. It’s simple, free, and surprisingly effective. Set up alerts for your brand name, your competitors' names, and important industry terms. Every time they get mentioned in a new article or blog post, you’ll get an email. It’s a dead-simple way to keep a pulse on your media SOV.
Picking the right software is a strategic move. You can get a great overview of your options by looking at some of the best competitive intelligence tools on the market.
Remember, the goal isn't to have the most expensive toolkit; it's to have the smartest one. By combining an affordable, focused tool like already.dev with a few free methods, you can get a powerful view of your share of voice and still have money left over for coffee.
Turning Your SOV Number Into a Winning Strategy
So, you’ve run the numbers and now you have your Share of Voice percentage. Maybe it’s 10%, maybe it’s 35%. Now what?
Staring at that number isn’t going to get you anywhere. A raw SOV figure is like having a single puzzle piece—it's pretty useless without the rest of the box.
The real value comes from adding context. A 10% SOV might feel like you're losing, but if you're a scrappy startup going up against giants like Google or Apple, that 10% is a huge win. On the other hand, a 40% SOV in a tiny niche market with only two other players might actually mean you're underperforming.
> The Big Idea: Your SOV isn't a final score. It's the starting whistle for building a smarter marketing strategy. It tells you where you are on the map so you can figure out where to go next.
Analyze, Strategize, and Act
Once you have your number, it's time to put it to work. Don't just file it away in a report nobody reads. Use it to find your competitor’s blind spots and carve out your own territory.
Your goal is to turn that data into action. Here’s a simple framework to get you started:
-
Analyze Your Position: First, line up your SOV next to your top three competitors. Who’s dominating the conversation? And where are they winning? Maybe your biggest rival has a massive organic search presence but is completely silent on social media. That’s not a threat; that’s an open invitation.
-
Strategize Your Next Move: Now, pick your battles. If a competitor owns the paid ad space, trying to outspend them is probably a fool's errand. A better move? Double down on that social media channel they’re ignoring. Find the gaps and rush in to fill them.
-
Take Action and Measure: Set a realistic goal. Maybe you aim to increase your SOV on that neglected channel by 5% over the next quarter. Create the content, engage with the community, and then—this is the important part—measure it again. Did your efforts actually move the needle?
This process gets even more powerful when you start pulling in more data, especially from social listening tools. For instance, if your brand got 20,000 social media mentions last month while your competitors collectively got 180,000, your social SOV is around 10%. You can learn more about tracking social SOV from the experts at Sprout Social.
This cycle of analyzing, strategizing, and acting turns SOV from a static number into a dynamic tool for growth. It helps you understand not just where you stand, but why you’re there.
For a deeper dive into figuring out why you win or lose against the competition, check out our guide on how to conduct a win and loss analysis.
A Few Common Share of Voice Questions
Alright, let's tackle some of the head-scratchers that always pop up when people start digging into share of voice. It’s easy to get lost in the weeds, but these quick answers should keep you on the right track.
How Often Should I Calculate My Share of Voice?
First off, please don't drive yourself crazy trying to calculate this every single day. For most businesses, checking your SOV on a monthly or quarterly basis is the sweet spot. This gives your marketing efforts enough time to actually make a difference that will show up in the data.
The only real exception? If you're in the middle of a massive product launch or a huge ad campaign, you might want to peek at it weekly. But for regular health checks, stick to a monthly or quarterly rhythm. You'll avoid chasing meaningless, day-to-day fluctuations and focus on the trends that matter.
Is a Low Share of Voice Always a Bad Thing?
Nope, not at all! Context is everything here.
If you’re a tiny startup trying to make waves in an industry with giants like Amazon or Apple, grabbing even a 2% share of voice could be a monumental achievement. You’re making a dent!
On the flip side, if you’re in a sleepy niche market with only three other competitors, a 2% share is a five-alarm fire. The goal isn’t to hit some magic number; it’s to understand your position relative to your direct competitors and work on steady, meaningful growth over time.
Can I Calculate SOV for My Local Business?
Absolutely, and you definitely should. For a local business, the process is actually more focused and powerful. Instead of trying to measure your visibility across the entire internet, you just shrink the playing field to what really counts.
Here’s how you'd approach it:
- For SEO: Track your rankings for the local keywords that bring in customers, like "best pizza in Brooklyn" or "plumber near me."
- For Social: Keep an eye on mentions, check-ins, and hashtag usage that are geographically tagged to your city or neighborhood.
The core principle of how you calculate share of voice stays exactly the same. You're still measuring your visibility against your local rivals, just within a much more defined and relevant service area. This helps you see who’s truly winning the battle for local customers right on your home turf.
Ready to stop guessing and start knowing where you stand against the competition? Already.dev uses AI to uncover your true competitors and give you the data-driven confidence to build a winning strategy. See how it works at https://already.dev.