Your Next Market Research Report Template
Stop staring at a blank page. Our market research report template turns complex data into clear, actionable insights your team will actually use.

A market research report template is basically a cheat sheet for organizing your findings. Honestly, it's a lifesaver. It gives you a ready-made structure so you can stop wrestling with slide decks and focus on delivering insights that actually mean something.
Stop Drowning in Data and Start Making Sense
Let's be real—building a market research report from scratch is a special kind of headache. You're swimming in spreadsheets, drowning in survey data, and juggling way too many browser tabs. All while the deadline just keeps getting closer.
This guide isn’t here to give you more work. It’s about handing you a lifeline: a simple, effective market research report template that turns raw numbers into a story that makes sense. Forget the corporate jargon and those 50-page snoozefests that put everyone to sleep.
We'll show you how to zero in on the findings your boss or client genuinely cares about. After all, nobody wants a data dump; they want answers.
Why a Template Is Your Best Friend
Using a template isn't cheating; it's just smart. It provides a solid foundation, freeing up your brainpower to focus on analysis instead of fiddling with formatting for hours. Think of it as a roadmap for your data. A good template makes sure you cover all the essential bases without getting lost in the weeds.
This reliance on clear, structured data is huge. The global market research industry is projected to hit about $140 billion, with a staggering 62% of organizations depending heavily on these reports to make big decisions. As the stakes get higher, efficiency is everything. You can learn more about the growing dependence on market research reports and the tech shaping the industry.
> Takeaway: Your goal isn't to present every single data point you found. Your goal is to tell a convincing story that leads to a smart business decision. A template helps you do just that by forcing you to organize your thoughts logically.
What Makes a Great Report?
A winning report doesn't just present facts; it builds an argument. It takes the reader on a journey from a problem to a solution, backed by solid evidence every step of the way.
Here are the core components that make a report truly effective:
- Clarity: It's easy to understand, even for someone who didn't conduct the research. No jargon.
- Brevity: It gets straight to the point without unnecessary fluff. Seriously, no one has time for that.
- Actionable Insights: It doesn’t just say "what," it explains "so what" and "now what."
This guide will give you a downloadable template and a quick-start guide to get you moving fast. You can spend less time fighting with formatting and more time finding those game-changing ideas that make all the tedious data collection worthwhile.
Craft an Executive Summary They Will Actually Read
Let's be brutally honest. Your stakeholders are busy people. They're jumping from meeting to meeting, and they might only read one single page of your entire report. This is that page.
The executive summary isn't just a brief intro; it's the whole story, condensed. Think of it as the movie trailer that’s so compelling, they feel like they’ve already gotten the main plot points. Your goal is to make this section so clear and powerful that it's impossible to ignore. It’s your one shot to land the most critical findings and recommendations.
Spill the Beans Right Away
The single biggest mistake people make is treating the executive summary like a mystery novel, building suspense until a grand finale. Don't do that. You need to deliver the knockout punch in the very first paragraph.
Imagine you have exactly 30 seconds to brief your boss before they run into their next meeting. What are the absolute must-knows?
- Lead with the Conclusion: What's the number one, most important thing you discovered? State it immediately. No warm-up.
- Flash the Big Numbers: Did you uncover a 45% increase in a market gap? A competitor with a shocking 70% churn rate? Put those bold numbers front and center.
- Make Clear Recommendations: Don't just point out problems. Give concrete, actionable solutions. "We found a problem" is useless. "We recommend launching Product B into the Midwest by Q3 to capture a $2M opportunity" is what gets attention.
This direct approach guarantees that even if they only skim the first few lines, they walk away with the most valuable insight. You can check out a great example of a market research report to see how a punchy summary grabs you from the start.
The Recipe for a Stand-Alone Summary
A truly effective executive summary should function as a cheat sheet for your entire document. It’s not just an introduction; it’s the conclusion, placed right at the beginning for maximum impact.
> The executive summary needs to stand on its own. If a decision-maker read nothing else, they should have enough information to feel confident in their next steps.
Essentially, you're creating a miniature version of the full report. Touch on the core components: the initial problem, a quick note on your methodology (and I mean quick), the most significant findings, and, most importantly, what to do next. This gives them the complete picture, building trust in your conclusions and making them want to dig deeper when they have a spare moment.
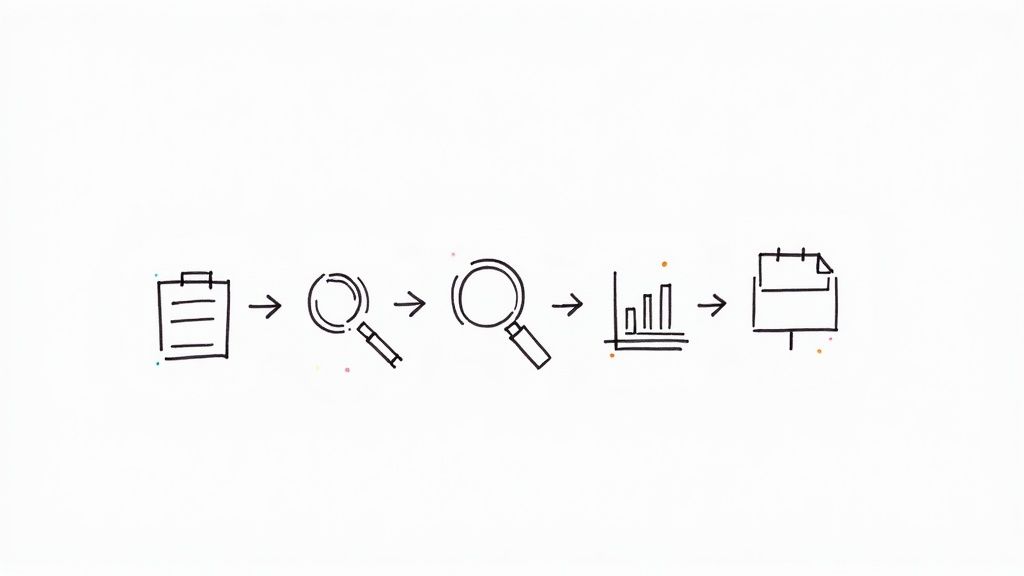
Turn Raw Data into a Compelling Story

So, you've done the hard work and gathered a mountain of data. Now for the really important part: turning those numbers and notes into a story that actually gets people to listen.
Let's be honest, nobody wants to read a dry document filled with charts and stats. That's a surefire way to get your recommendations ignored. Your real mission here is to become a storyteller. The data isn't the story itself—it's the evidence you use to tell a compelling story about the market.
Think of this section of your template as painting a picture of the battlefield. You’re showing your team exactly where the opportunities are and how to attack.
Sizing Up the Sandbox You Play In
Before you can figure out how to win, you have to know the size of the playing field. This means getting specific about the market size with real, hard numbers. "Big" is not a useful metric. Is it growing? Shrinking? Stagnating?
This is where you drop the numbers that actually matter:
- Total Addressable Market (TAM): This is the pie-in-the-sky number. If you could capture every single potential customer in the world for your product, what would that look like?
- Serviceable Addressable Market (SAM): Okay, let's get more realistic. Who can you actually reach with your current sales channels and business model? This is your target zone.
- Serviceable Obtainable Market (SOM): Now, let's narrow it down even more. What piece of that SAM can you realistically win over in the next few years? This is your immediate goal.
Putting solid numbers to these concepts makes the opportunity feel real. A good template will have a spot for specific metrics, like a 12% compound annual growth rate (CAGR), to show there's momentum. Suddenly, a vague idea becomes a tangible business case worth pursuing.
Spying on the Competition (Ethically, of Course)
Alright, you know the market size. Now, who are you up against? A simple list of competitors is just noise. You need to get into their heads and understand their game plan.
> Your competitor analysis needs to answer one critical question for your team: "How are we going to win against these guys?"
To get to that answer, you need to break down their operations:
- Market Share: Who are the big players, and who are the scrappy up-and-comers? Knowing that the top three competitors control 55% of the market tells you it's a concentrated field where you have to fight for every inch.
- Strategies: How do they go to market? Are they the low-cost leader, the premium-quality choice, or are they innovating in a niche?
- Strengths & Weaknesses: What do their customers rave about? Even more importantly, what are they complaining about in online reviews and forums? Those complaints are pure gold—they're your openings.
Tools like Semrush or Ahrefs are brilliant for this kind of intelligence gathering, but they can come with a hefty price tag. For a more accessible option, platforms like already.dev can give you powerful competitive data and SEO insights without draining your budget. You can also check out our guide on https://blog.already.dev/posts/ai-powered-market-research to see how modern tools can automate a lot of this grunt work. The end goal is simple: find the chinks in their armor and plan your attack.
Get to Know Your Real Customer
So, who are you actually selling to? If your answer is a vague "millennials" or "small businesses," we need to talk. Any solid market research report is built on a foundation of knowing your customer so well you could pick them out of a crowd.
This goes way beyond basic demographics. We need to dive into psychographics—the stuff that makes people tick. What are their real motivations? What keeps them up at night? What do they truly value?
Knowing your customer is a 35-year-old manager is one thing. Knowing they're a 35-year-old manager who's terrified of falling behind on new tech trends? That's where the magic happens. This deep understanding informs everything from product development to marketing messages that actually land.
Building Personas That Aren’t Just Cartoons
Let's be clear: a customer persona isn't just a stock photo with a cute name and a list of hobbies. It has to be a practical tool built on real data, not just a bunch of assumptions. Think of it as a character sketch for the hero of your business's story.
To build a persona that’s genuinely useful, you need to pull from a few key sources:
- Survey Data: This gives you the big-picture, quantitative view of their goals, challenges, and where they hang out online.
- Customer Interviews: Honestly, this is where you'll find the gold. Actually talk to people. Listen to the exact words they use to describe their problems.
- Product Analytics: This shows you what people do, not just what they say. Where do they click? What features get all the love?
These days, research is getting more and more digital, which is great for us. About 85% of researchers use online surveys, and 34% are doing online in-depth interviews to get those qualitative gems. It’s pretty much the standard way to get inside your customer's head. You can read more about modern market research trends to see how things are evolving.
Mapping the Real Customer Journey
Okay, you've got your persona sketched out. Now, what's their journey to actually buying from you? Spoiler: it’s not a straight line. It's a messy, winding road filled with questions, doubts, and a whole lot of Googling.
> A great market research report doesn't just describe the customer; it describes the customer's world. This includes the frustrations they face and the specific triggers that push them to look for a solution.
Your job here is to pinpoint the specific pain points at each stage of their journey. What first makes them realize they have a problem? What information do they need to feel confident enough to move forward? And what are the deal-breakers that make them bail?
Answering these questions is what elevates your market research report template from a simple document into a strategic playbook for your entire company. It’s the secret to making decisions that actually connect with the people who keep your business alive.
Transform Your Findings into Actionable Next Steps
Alright, you've done the heavy lifting. You’ve wrestled with the data, wrangled the charts, and built a beautiful market research report. But let's be honest, if that final section is just a limp summary, your entire report is destined to become a very expensive paperweight.
This is the "So what?" moment. It’s where you shift gears from data librarian to strategic advisor. A report without clear, confident recommendations is just an expensive book report. This is your chance to prove the real value of all that hard work and guide the team toward smarter decisions.
Don't Just Suggest—Recommend with Confidence
There’s a world of difference between a weak suggestion and a strong recommendation. A weak suggestion is vague, non-committal, and easy to ignore. A strong one is specific, measurable, and tied directly to the data you’ve just painstakingly presented.
It’s the difference between saying, "We should probably improve our social media," and saying, "We need to launch a targeted Instagram campaign for Gen Z in Q3 to capture the 15% market gap we identified." One is a thought bubble; the other is a plan.
Think of it this way: your data is the evidence, and your recommendation is the verdict. You’ve already proven the case—now you just need to deliver the sentence.
> A recommendation is an opinion backed by your research. Don't be shy about it. You are the expert in the room on this specific topic, so own it and provide a clear path forward.
For entrepreneurs just starting out, framing these recommendations correctly is half the battle. If you're looking to get into the right mindset for turning insights into real-world business moves, check out our guide on market research for entrepreneurs.
From Vague Ideas to Concrete Actions
The best way to get stakeholders on board is to make your recommendations impossible to misinterpret. They should be so clear that anyone can immediately understand what needs to happen next.
Here’s a quick example of how to sharpen a fuzzy finding into an actionable recommendation:
- The Finding: Our competitor's website is confusing, and customers are vocal about it.
- The Weak Suggestion: "We should make our website better."
- The Strong Recommendation: "Allocate $5,000 to a UX audit in Q2, focusing on streamlining the checkout process to reduce cart abandonment by 10%."
See the difference? The strong recommendation gives the team a specific action, a budget, a timeline, and a measurable goal. It’s a clear target to aim for.
To really drive this home, here’s a simple framework for translating your research data into clear, strategic recommendations that actually drive business decisions.
Turning Findings into Actionable Recommendations
| Data Finding Example | Weak Recommendation | Strong Recommendation | | :--- | :--- | :--- | | 72% of survey respondents said our pricing is confusing. | "We should simplify our pricing." | "Revamp the pricing page in Q3 to introduce a three-tiered model (Basic, Pro, Enterprise) and A/B test clarity with 20 existing customers." | | Our main competitor gets 50% more organic traffic from "how-to" articles. | "We need to do more content marketing." | "Launch a blog series of four 'how-to' articles per month focused on our top 3 identified customer pain points to increase organic traffic by 20% in six months." | | Customer feedback indicates our onboarding process is too long. | "Let's improve the onboarding experience." | "Redesign the user onboarding flow to reduce the number of steps from nine to five, aiming for a 15% increase in user activation rates by the end of Q4." |
This table shows how to add the necessary detail—the what, the when, the how much, and the why—that turns a vague idea into a real project that people can get behind.
Visualizing Your Data for Impact
Part of making your recommendations stick is presenting the data behind them in a way that’s instantly understandable. Choosing the right chart is crucial for telling a clear story and backing up your final points. This infographic is a great cheat sheet for when to use a bar chart versus a pie chart to make your point effectively.
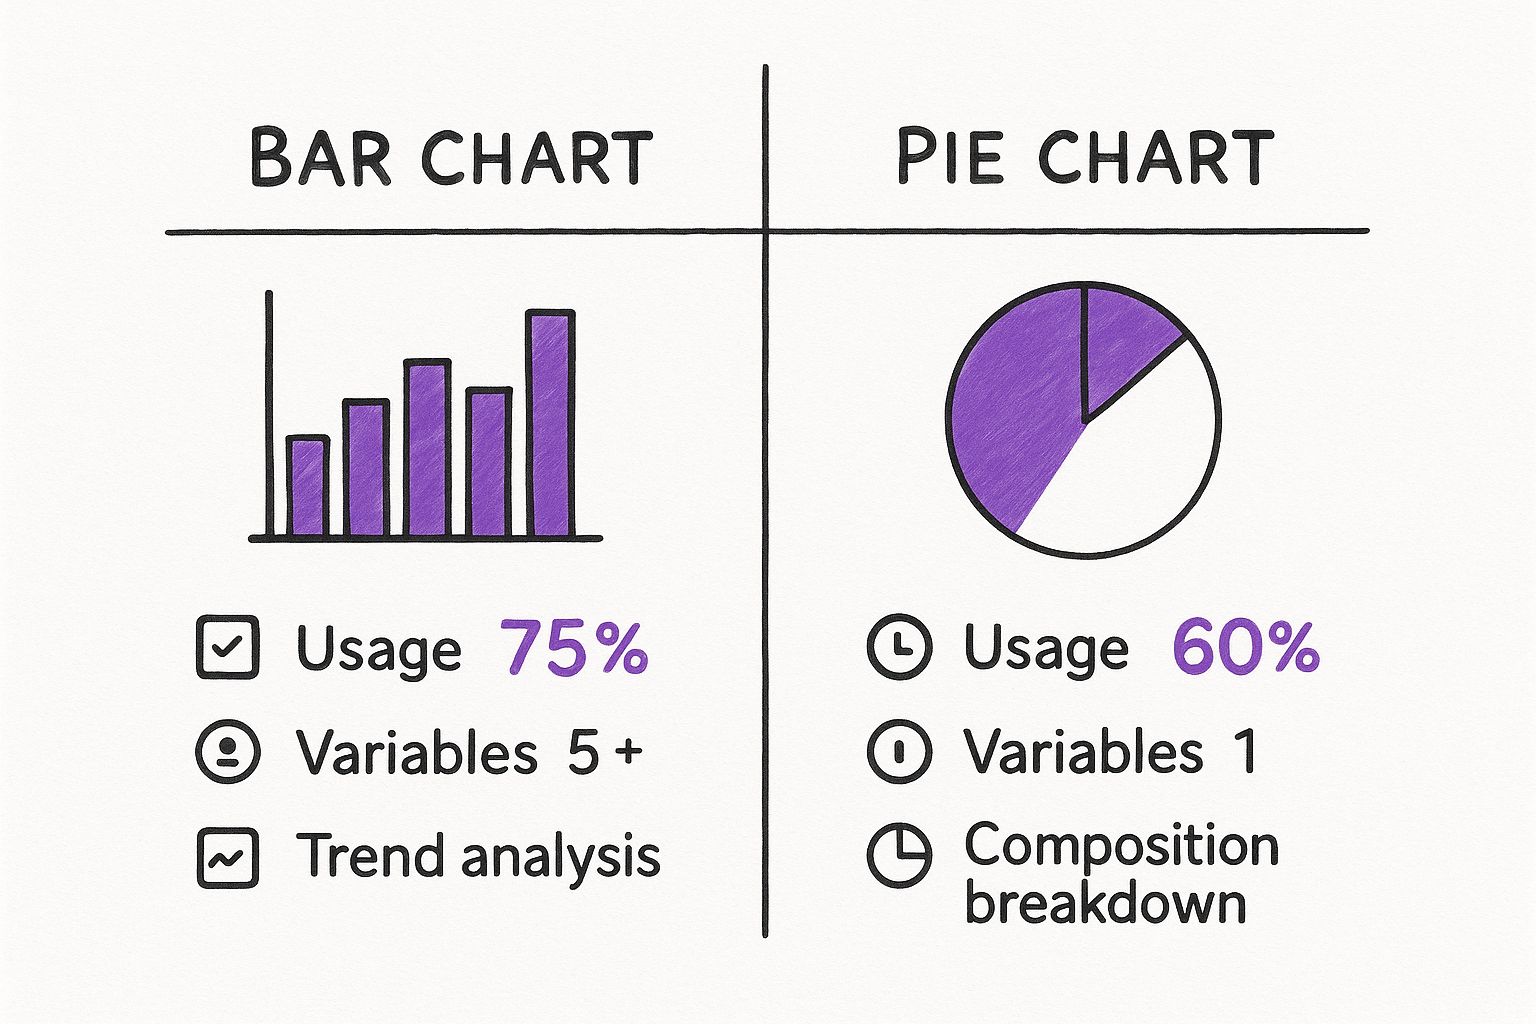
The key is to match the visualization to what you’re trying to say. Bar charts are fantastic for comparing different items, while pie charts are perfect for showing parts of a whole.
Don't let your hard-won report just sit on a shelf. Make it a catalyst for real, meaningful action.
Got Questions About Market Research Reports?
You're not alone. When you're putting together a market research report, a few questions always seem to pop up. Let's walk through some of the most common ones I hear from teams all the time.
Think of this as a quick-and-dirty FAQ to help you sidestep common pitfalls and make sure the report you build actually gets used.
How Long Should My Report Be?
The honest answer? As short as you can possibly make it without losing the core message.
Seriously, nobody wants to wade through a 100-page market analysis. Your stakeholders are busy. Most executives will probably only read the executive summary anyway, so you need to make every page count.
Your job isn't to create a massive document to prove you did the work; it's to arm your team with the insights they need to make a smart decision. If you can tell the whole story in 15 slides instead of 50, you’re not being lazy—you’re being effective.
> The best market research report is long enough to be convincing but short enough to actually be read. Brevity is your superpower here.
What Tools Do I Actually Need for the Research?
This really boils down to your budget and the specific questions you're trying to answer.
For really deep competitive intelligence, you've got the heavy hitters like Ahrefs and Semrush. They're fantastic, but let's be real—they can be expensive. Think of them as the luxury sports cars of market data.
If you're looking for a more accessible option that still packs a punch, a tool like already.dev is a great way to get automated competitive research done. It's designed to help you pinpoint competitors and understand market positioning without a massive financial commitment.
Beyond that, your toolkit can be surprisingly simple:
- Surveys: Google Forms or SurveyMonkey are perfect for gathering quantitative feedback directly from your audience.
- Analytics: Don't forget about Google Analytics. It's a free goldmine of information about your own customers and website visitors.
- Real Conversations: This is my favorite. Never, ever underestimate the power of just talking to your customers. It costs you nothing but time and often delivers the most potent, game-changing insights.
Primary vs. Secondary Data: Which One Matters More?
That’s like asking if a car needs an engine or wheels. You can't get anywhere without both working together.
Primary data is the stuff you gather yourself—think surveys, customer interviews, or focus groups. It’s custom-tailored to your exact questions, but it takes time and legwork to collect.
Secondary data is research someone else has already published, like industry reports, government statistics, or competitor analyses. It's way faster to access and gives you that crucial big-picture context, but it wasn't made specifically for you.
A truly powerful market research report weaves these two together. You start with secondary data to understand the broader landscape, then you deploy primary research to drill down into how those trends specifically impact your business and your customers. One provides the "what," and the other provides the "so what."
Ready to stop guessing and start knowing? Already.dev uses AI to run a comprehensive competitive analysis in minutes, not weeks. Describe your idea, and our automated agents will find every direct and indirect competitor, analyze their features, and deliver a report that gives you a true strategic advantage.