What Is Total Addressable Market? A Simple Explainer For Humans
Confused about what is total addressable market? This guide explains TAM, SAM, and SOM with simple analogies, real examples, and clear formulas.
Let's ditch the stuffy MBA textbooks for a minute.
Your Total Addressable Market (TAM) is just the biggest, most ridiculously large pizza you can imagine for your business. It’s the total cash you could in theory rake in if every single person who could possibly use your product actually bought it.
Simple, right?
Your Giant Pizza Pie Market, Explained
Let's run with this pizza idea. Say you invented a life-changing new pizza topping. Your TAM would be the total amount of money everyone on Earth spends on all pizzas in a year. It's a huge, almost silly number you’ll never actually capture.
So why bother? Because investors, founders, and anyone with a brain needs a North Star. It answers the big question: "Just how big could this thing get?" A massive TAM shows you're not thinking small and gets people excited about the potential.
From the Whole Pie to Your Actual Slice
Obviously, you're not going to sell your topping to every pizza joint on the planet from day one. You have real-world problems like shipping, language barriers, and the fact you currently operate out of your garage. This is where we slice that giant pie into something you can actually eat.
This is a core part of any real market opportunity assessment, as it connects your grand vision to reality on the ground.
> The Simple Breakdown: Your market isn't one number. It's a set of nested targets. You start with the biggest dream (TAM) and get more realistic from there (SAM and SOM). Nailing all three is how you prove you're not just making stuff up.
To make this dead simple, let's break down the pie slices.
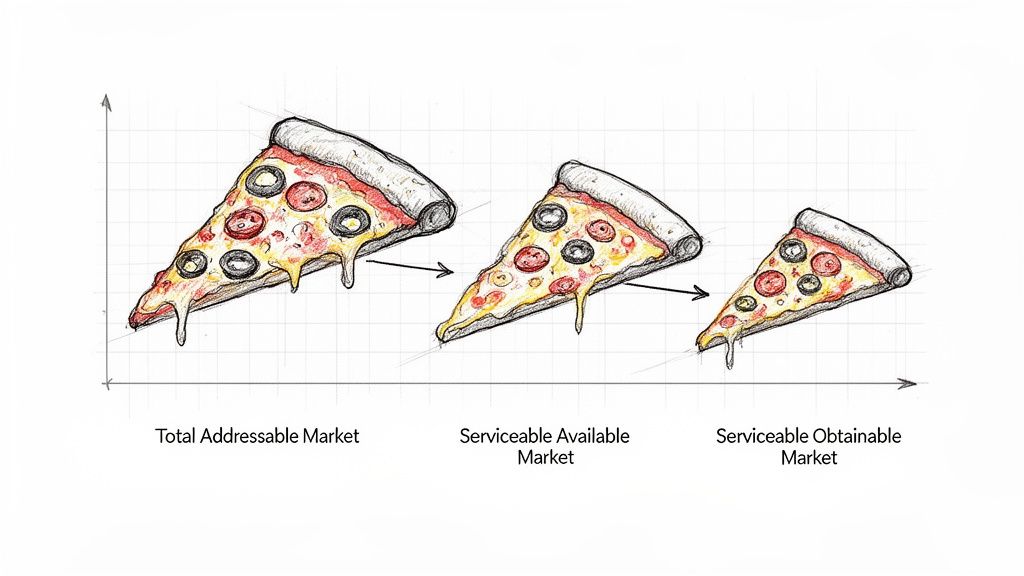
TAM vs SAM vs SOM: The Pizza Analogy
| Concept | The Simple Explanation | The Pizza Analogy | | :--- | :--- | :--- | | Total Addressable Market (TAM) | The total demand for a product or service, everywhere. | Every single pizza sold in the entire world. | | Serviceable Addressable Market (SAM) | The segment of the TAM you can actually reach. | All the pizzas sold in the cities you can deliver to. | | Serviceable Obtainable Market (SOM) | The piece of SAM you can realistically win soon. | The number of pizzas you can sell in your neighborhood this year, given the competition. |
Seeing it like this makes it obvious: your immediate goal isn't world domination. It's to win your neighborhood first.
Why This Is More Than Just a Pretty Slide
Figuring out your TAM isn't just busywork to make your pitch deck look fancy. It’s a strategic gut-check that forces you to get super specific about who your customers are, where they are, and what you're actually selling them.
A well-researched TAM shows you get the competitive landscape. It tells everyone you’re not just winging it; you've found a real, juicy opportunity worth chasing. Without it, you're just a ship with no map, hoping to bump into an island.
Three Proven Methods for Calculating Your TAM
Okay, you get the "giant pizza" idea. But how do you figure out how big that pizza is without just pulling a number out of thin air? (Pro tip: making up numbers is a great way to get laughed out of a pitch meeting).
Luckily, you don't have to guess. There are three standard, investor-approved ways to calculate your TAM. Each gives a different perspective, and the smartest founders use a mix to create a number that's both ambitious and believable.
The Top-Down Approach: The Telescope Method
The top-down approach is the fastest way to get a big, flashy number. You start with a huge market report from a fancy source (like Gartner or Forrester) and then carve out your slice.
Let’s say you're launching a new organic dog food. You find a report saying the global pet food market is worth $100 billion. That’s your universe.
Then you start filtering:
- What chunk of that is dog food? Let's say 60%, putting us at $60 billion.
- What about just organic dog food? If it’s 10%, our market is now $6 billion.
- And just in North America (your target)? If that's 50%, you’ve landed on a TAM of $3 billion.
It's fast and gives you a big-picture number, but be warned: investors know this method is built on broad assumptions. Be ready to defend every single percentage.
The Bottom-Up Approach: The Building Blocks Method
Investors love the bottom-up approach because it proves you've actually done your homework. Instead of starting big and shrinking down, you build your market from the ground up, customer by customer. It’s more work, but the result is way more credible.
Let's say you're building a project management tool for small, remote marketing agencies.
First, you'd figure out how many of those agencies exist. You'd dig through LinkedIn, industry directories, and government data. Maybe you find 50,000 of them in your target countries.
Next, you set a realistic price. Let's say your annual plan is $1,200 per agency.
The math is simple: (Total Number of Potential Customers) x (Annual Price Per Customer) = TAM.
So, your calculation is 50,000 agencies x $1,200/year = $60 million TAM. See? It's a much more grounded and defensible number because it's built on your specific customer and price. To do this right, understanding the essential types of market research is key for getting accurate data.
The Value Theory Approach: The "We're Inventing the Future" Method
The value theory approach is for when you're creating something brand new or so much better that it changes the game. This method estimates TAM based on the value you create for a customer and how much of that value you can capture with your price.
It's all about answering: How much is this new superpower worth to my customers?
Think about the first company to offer cloud storage. There was no "cloud storage market report." They had to estimate their TAM by looking at what businesses were spending on physical servers and IT staff, and then calculating the value of a cheaper, better way.
A modern example could be competitive intelligence tools. You might look at related markets. For instance, the productivity tools market is huge: email at $3 billion, video conferencing at $8 billion, project management at $5 billion—a combined $16 billion right there. You could argue you’re creating a new slice of that pie.
This method is more abstract but essential for truly disruptive products. You'll need deep customer insight to pull it off, which is why our guide on how to conduct market research is a must-read.
A Step-by-Step Bottom-Up TAM Calculation
Alright, let's get our hands dirty. While top-down gives you a big, flashy number, the bottom-up approach is what makes investors lean in. Why? Because it proves you've done the work on your specific customers, not just waved around some giant industry report.
Think of it this way: top-down is saying "the pizza market is huge." Bottom-up is saying, "I know exactly how many houses in my neighborhood order pizza on Friday, and I know what they'll pay."
You're building your market from the ground up. It’s more work, but the result is a number you can actually defend.
This infographic shows how the three methods work, with bottom-up using individual customer blocks to build a market size.
The key is where you start. Top-down starts with the universe; bottom-up starts with a single customer.
Step 1: Identify Your Ideal Customer Segments
First: who are you actually selling to? And I mean really. "Everyone" is not an answer. Let's stick with our project management tool for remote marketing agencies.
Our customer segments might look like this:
- Micro-Agencies: Scrappy teams of 2-5 people.
- Small Agencies: Growing teams of 6-15 people.
- Established Small Agencies: More stable teams of 16-30 people.
See how specific that is? We’re not targeting huge corporations. This focus is what makes bottom-up so convincing.
Step 2: Find the Number of Customers in Each Segment
Now, the detective work. You need to find out how many of these companies exist in your target area (let's say North America). You have to get creative here.
Here are a few places to start digging:
- Professional Networks: Use tools like LinkedIn Sales Navigator to filter companies by industry, size, and location.
- Business Directories: Check B2B review sites like Clutch or G2, or find industry-specific lists.
- Government Data: Public resources from census bureaus can give you counts of businesses by industry code.
After some digging, let's say you find 20,000 Micro-Agencies, 15,000 Small Agencies, and 5,000 Established Small Agencies.
Step 3: Determine Your Average Revenue Per Customer
Next, what are you going to charge? For our tool, let’s say our pricing tiers are based on team size.
- Micro-Agency Plan: $1,000 per year
- Small Agency Plan: $2,500 per year
- Established Agency Plan: $5,000 per year
This is your Annual Contract Value (ACV) per segment. Be realistic. This isn't some dream price you hope to charge someday—use the price you'll actually launch with.
> Pro Tip: Your price should reflect the value you provide. If your tool saves an agency $10,000 a year in lost productivity, charging $1,000 is a no-brainer for them.
Step 4: Do the Math and Calculate Your TAM
This is the easy part. Multiply the number of customers by the average revenue, then add it all up.
- (20,000 Micro-Agencies x $1,000/year) = $20,000,000
- (15,000 Small Agencies x $2,500/year) = $37,500,000
- (5,000 Established Agencies x $5,000/year) = $25,000,000
Total Addressable Market (TAM) = $20M + $37.5M + $25M = $82,500,000
Boom. A TAM of $82.5 million. It might not be a multi-billion dollar number, but it’s real, it’s specific, and it's a number you can confidently defend.
How Competitive Research Defines a Realistic Market
Calculating your TAM is like spotting an oasis in the desert. But here's the reality check: you're not the only thirsty person who's seen it. Your competitors are already there.
Your TAM doesn't exist in a vacuum; it’s a crowded space. Knowing the size isn't enough. You have to figure out how much is actually up for grabs. This is where solid competitive research helps you define a believable—and fundable—Serviceable Obtainable Market (SOM).
A huge TAM gets people excited. A well-defended SOM gets checks written.
Finding Your Slice of the Pie
Competitive analysis isn't just about listing your rivals. It's about understanding the battlefield. By dissecting what everyone else is doing, you can find a slice of the market for yourself.
Here’s what you should be digging into:
- Competitor Pricing: Are they the cheap option or the premium one? This directly shapes your own pricing and what you can earn.
- Key Features: What problems are they solving? Spotting feature gaps is your golden ticket to peeling off their customers.
- Market Share & Positioning: Who are the giants and who are the scrappy upstarts? Knowing this helps you set realistic goals.
This whole process is about moving from "what's possible" (TAM) to "what's plausible" (SOM). To ground your estimates in reality, you have to embrace the importance of due diligence, which always includes a deep dive into the market.
Using the Right Tools for the Job
So, how do you get this intel without hiring a private investigator? You use smart tools. Big platforms like Ahrefs or Semrush give you tons of data, but let's be real, they can be crazy expensive. A great, more focused alternative is a tool like already.dev, which is built for this kind of deep research. You can map out the entire competitive landscape without blowing your budget. It turns a week-long slog into a data-driven strategy you can build in minutes.
> The Big Takeaway: Your market size is only as credible as your understanding of the competition. Without it, your TAM is just a vanity metric. With it, your SOM becomes a real roadmap for growth.
By understanding your competitors, you're in a much better position to place your own product. For a more detailed guide, check out our post on how to conduct competitive analysis.
Ultimately, this research turns your pitch from, "Imagine if we captured this huge market!" to "Here is exactly how we're going to win our first 1,000 customers." Now that’s a conversation investors want to have.
Common TAM Mistakes That Make Investors Cringe
Pitching your TAM is a tightrope walk. Too small, and investors will yawn. Too big, and they'll think you're delusional.
Getting your TAM wrong doesn't just make you look unprepared; it can kill a deal before you even get to the good part. Let's cover the classic blunders so you can avoid them.
The Infamous "1% of China" Fallacy
This is the king of all TAM mistakes. It sounds like this: "The market for widgets in China is $100 billion. If we can just capture 1%, we'll be a billion-dollar company!"
It sounds logical for a second, but it’s a massive red flag.
This argument shows zero understanding of the market, the competition, or the insane effort it takes to capture even 0.01% of a market. It’s a lazy shortcut that tells investors you haven't done the real work.
> Investor Translation: "This founder has no real plan. They're just hoping to get lucky."
Instead of a vague percentage, show them you know exactly which 10,000 customers you're targeting first and why they'll choose you.
Confusing Your TAM, SAM, and SOM
You’ve seen the nested dolls diagram: TAM is the biggest, SAM is inside, and SOM is the tiny one in the middle. They are not the same thing. But tons of founders treat them like they are.
Saying "Our market is $50 billion!" (your TAM) when you can realistically only serve North America right now (your SAM) just makes you sound out of touch.
Investors need to see the whole picture:
- TAM: How big is the ultimate dream?
- SAM: What part can you realistically target?
- SOM: What piece can you actually win in the next 12-18 months?
Showing you get these distinctions proves you’re a strategist, not just a dreamer.
Using Prehistoric Data
The business world moves fast. A market report from 2019 might as well be from the Stone Age. Using outdated data is like using an old map to navigate a new city—you’re going to get lost.
Investors will notice. If your data is old, they’ll question your entire analysis. Always hunt for the most recent reports you can find. When using research tools, check that their data is fresh. While platforms like Ahrefs and Semrush are powerful, they can be pricey. A more focused and budget-friendly alternative like already.dev can help you map the competitive landscape with up-to-the-minute data.
Before any pitch, run through this quick sanity check.
TAM Pitching Dos and Don'ts
| The Do ✅ | The Don't ❌ | | :----------------------------------------------------------------------------------------------- | :----------------------------------------------------------------------------------------- | | Use a bottom-up approach to show you've done the homework on specific customer segments. | Rely solely on the "1% of a huge market" argument. It's lazy and unconvincing. | | Clearly define your TAM, SAM, and SOM to demonstrate a realistic, phased go-to-market plan. | Use TAM, SAM, and SOM interchangeably. It shows a lack of strategic depth. | | Cite recent, credible data sources from the last 12-18 months to prove your analysis is current. | Use outdated market reports that no longer reflect the current state of the industry. | | Be prepared to defend every assumption in your calculation with logic and data. | Present a single, giant number without explaining the methodology behind it. |
Nailing your TAM isn't about the final number; it's about showing investors you have a deep, nuanced understanding of the market you're about to conquer. Get that right, and you're already halfway there.
Got Questions About TAM? We've Got Answers.
We've covered a lot, but you might still have a few questions. Let's clear them up with some straight talk.
How Often Should I Recalculate My TAM?
Think of your TAM as a living number, not something you carve in stone. Markets are always changing.
A good baseline is to revisit your TAM at least once a year. But if you’re in a fast-moving space like AI, or if a major event happens (like a pandemic), you should probably look every six months. The point is to make sure your strategy is based on today's reality, not yesterday's news.
What's a Good TAM Size for a VC-Backed Startup?
Ah, the billion-dollar question. There's no magic number, but most VCs get interested when the TAM is at least $1 billion. Why? Venture capital is a high-risk game. They need their wins to be massive—big enough to pay for all their other failed bets.
> A billion-dollar market tells an investor that even if you only grab a small slice, the potential return could still be huge. A $50 million TAM might make for a fantastic lifestyle business, but it doesn’t have the 10x-100x potential VCs need.
But don't just pull a billion-dollar figure out of thin air. A rock-solid, bottom-up TAM of $800 million that you can defend is way more credible than a flimsy $5 billion TAM you came up with using the "1% of China" method.
Can My TAM Actually Grow Over Time?
Of course! And it should. The best companies don't just play in their market; they make it bigger.
Here are a few ways your TAM can expand:
- Going Global: You launch in a new country and add a whole new population of customers.
- Building New Stuff: You add a new feature that solves a problem for a totally different group of people.
- Riding a Wave: Sometimes the market just gets bigger. The explosion of remote work, for example, grew the TAM for all collaboration software.
Think of your first TAM as your starting point, not the final destination.
What if My Market Doesn't Exist Yet?
Welcome to the innovator's club! If you’re creating a new category—like Airbnb did—you won't find an industry report for it. This is where the Value Theory method is your secret weapon.
You have to build your TAM by looking at what people are doing instead. Ask yourself:
- What are customers spending money on right now to solve this problem? (For Airbnb, this was hotels and hostels).
- How much better is my solution, and what's that added value worth?
This path requires more storytelling, but it’s how you define a category, not just a company. You’re showing investors how you’re going to build a market from scratch.
Understanding your market is the first step, but outsmarting it is the goal. For deep, AI-driven competitive research that uncovers every rival and opportunity, Already.dev turns weeks of manual work into a four-minute report. Get the data-driven confidence you need at https://already.dev.