Build a Market Positioning Matrix That Wins (Without a Boring MBA)
Learn how to build a market positioning matrix to find untapped opportunities, understand your competition, and create a winning brand strategy.
Think of a market positioning matrix as a treasure map for your business. It's a simple chart that shows where your brand, your competitors, and your next big idea live inside your customers' heads. It’s your secret weapon for spotting overcrowded markets to avoid and wide-open opportunities just waiting for you.
What Is a Market Positioning Matrix Anyway?
Let's be honest, most marketing jargon is confusing nonsense designed to make you fall asleep. But the market positioning matrix (sometimes called a perceptual map) is different. It’s not some pointless spreadsheet destined to be forgotten in a shared drive. This is a tool that gives you instant clarity on where you stand and where you should go next.
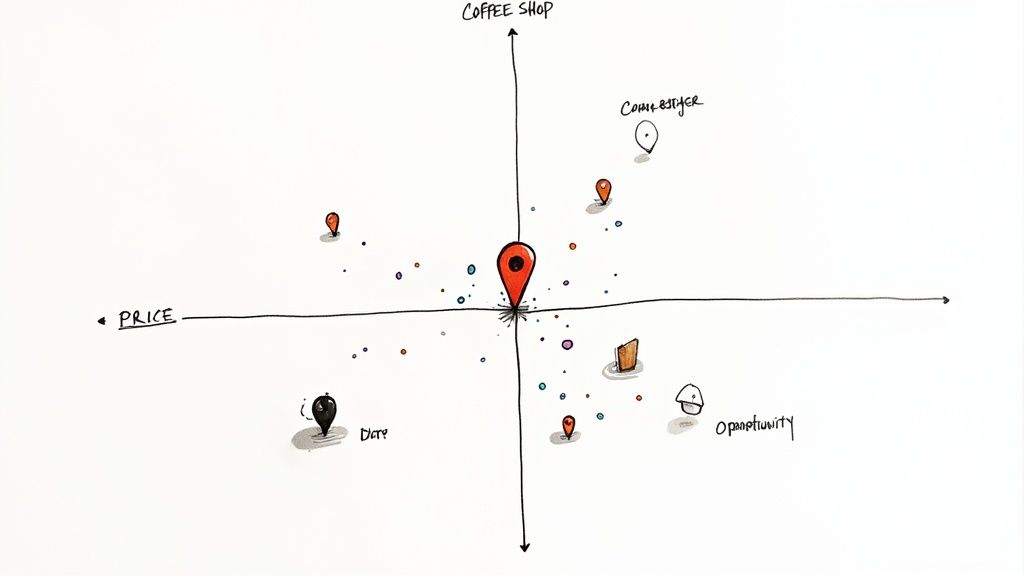
Imagine you want to open a new coffee shop. You wouldn't just pick a random corner and start brewing, would you? Of course not. You’d walk around, see where the other shops are, and figure out what makes them tick. Is one super cheap but serves burnt coffee? Is another pricey but has amazing vibes and free Wi-Fi?
A market positioning matrix does the same thing, but for any business. It helps you visually map out the competitive landscape based on the things customers actually care about.
Why This Simple Chart Is So Powerful
This isn't just a pointless exercise for a business school class; it's a seriously practical tool that forces you to answer the most important questions about your business. When you get it right, this simple grid can change everything.
For a quick look at the core benefits, check out this table.
Why You Need a Positioning Matrix
A quick look at the core benefits of using a market positioning matrix for your business strategy.
| Benefit | Why It Matters for Your Business | | :--- | :--- | | Identifies Market Gaps | It helps you spot the "unclaimed territory" in your market—a specific customer need that no one else is meeting. | | Clarifies Your Competition | You might find out your true competitors aren't who you thought they were. This map shows you who you're really up against in the customer's mind. | | Validates Your Strategy | It's a quick reality check. Is your unique selling proposition (USP) actually unique, or are you just another face in the crowd? | | Guides Product Development | Seeing the gaps can inspire new features or entirely new products that perfectly target an underserved audience. | | Simplifies Communication | Forget dense, 50-page reports. A single matrix can explain your entire competitive strategy to your team in about 30 seconds. |
Basically, the matrix turns vague market "feelings" into a concrete visual plan.
> A positioning matrix is the fastest way to stop guessing and start making smart, data-driven decisions. It shows you exactly where to play and how to win.
Avoiding the Analysis Paralysis Trap
The whole point here isn't to create the world's most complicated chart. The beauty of the market positioning matrix lies in its simplicity. It’s about taking a bunch of complex data and making it so clear that the next steps become obvious.
You don't need expensive, all-in-one SEO tools like Ahrefs or Semrush to get started, though they can certainly help with deep-dive competitor research later on (if your wallet can handle it). Sometimes, a more focused tool like already.dev can give you the competitive insights you need without the overwhelming complexity.
Ultimately, this map helps you stop throwing spaghetti at the wall to see what sticks. Instead, you can confidently find your spot, plant your flag, and build a brand that truly stands out from the noise.
Choosing Your Map's True North
Your market positioning matrix is only as good as its directions. Choosing the right axes—the X and Y variables for your map—is the single most important step. It's also where most people get hopelessly lost, creating a chart that looks smart but tells them absolutely nothing useful.
Think of it like this: if you're mapping out local coffee shops, using "Number of Windows" vs. "Color of Front Door" as your axes is pointless. Sure, it’s data, but it doesn't tell you anything about why a customer chooses one over the other. You have to lock onto the dimensions that your customers actually care about when making a choice.
This is the "True North" of your map—the core values that guide customer decisions in your specific market. Get these right, and the path to a winning position becomes crystal clear.
Ditching Vanity for Value
The first temptation is to pick axes that make you look good. Don't. You have to resist the urge to use vague, self-serving metrics like "Most Innovative" or "Best Culture." Customers don't buy "culture"; they buy solutions to their problems. Your axes must reflect the real-world trade-offs they consider every day.
So, how do you find these magical axes? You have to get inside your customers' heads. Before you can map the landscape, you need a clear picture of who you're mapping it for. Figuring out how to identify target customers is the essential first step before you even think about drawing a grid.
Once you know your audience, start brainstorming the key factors they weigh. Here are a few classic pairs that work across many industries just to get your ideas flowing:
- Price vs. Quality: The oldest trade-off in the book. Are you the affordable, good-enough option or the premium, high-performance choice?
- Convenience vs. Customization: Do customers want a quick, one-click solution or a highly personalized, bespoke experience?
- Simple vs. Feature-Rich: Is your product a streamlined tool that does one thing perfectly, or is it a powerful Swiss Army knife packed with features?
- Niche vs. Broad Appeal: Are you serving a very specific audience (e.g., accountants in the crypto space) or trying to capture the mass market?
> Your axes should create a little tension. They should represent a real choice a customer has to make. If everyone can be "high quality" and "innovative" at the same time, your axes aren't sharp enough.
Real-World Examples to Steal From
Let's move from theory to reality. For a SaaS company, the axes might be "Ease of Use vs. Power/Functionality." A tool like Canva would sit high on "Ease of Use" but lower on "Power," while Adobe Photoshop would be the complete opposite.
For a local bakery, it could be "Traditional Comfort vs. Modern & Healthy." One corner of the map would be occupied by the classic cupcake shop with buttery frosting, while the other corner holds the gluten-free, vegan bakery using alternative sweeteners. Both are perfectly valid positions, but they serve entirely different people.
Here's a quick table to spark more ideas:
| Industry | Potential Axis 1 | Potential Axis 2 | | :--- | :--- | :--- | | E-commerce Clothing | Fast Fashion | Slow & Sustainable | | Fitness App | Guided & Structured | Self-Directed & Flexible | | Consulting Firm | Specialized Expertise | Generalist Services | | Car Brands | Performance & Speed | Safety & Reliability |
How to Validate Your Axes (Without Going Broke)
You don't need a six-figure market research budget just to confirm your assumptions. The goal here is to get directional feedback, not statistical perfection.
First, dive into customer reviews for your product and your competitors. What words do people constantly repeat? Are they praising your "amazing support" or complaining that a competitor's product is "too complicated"? These are raw, unfiltered clues right from the source.
Next, you can analyze search data. Using expensive tools like Ahrefs or Semrush can reveal what people are searching for, but they come with a hefty price tag. A more accessible alternative like already.dev can help you uncover the keywords and phrases your target audience uses, giving you direct insight into their priorities. Are they searching for "easy accounting software" or "advanced financial modeling tools"? The language they use is your guide.
Once you've identified your ideal positioning, a robust B2B go-to-market strategy framework provides the blueprint for how you'll introduce your offering to the chosen market. Choosing the right axes is the very first step in building that plan.
How to Build Your Matrix Step by Step
Alright, theory time is over. Let's roll up our sleeves and actually build this thing. Creating a market positioning matrix isn't some abstract academic exercise; it's a practical tool, and I'm going to show you how to make one.
Think of it less like rocket science and more like drawing a map for a road trip. You need to know where you are, where everyone else is, and where the open roads are. We'll break it down into five simple steps to get you from a blank page to a powerful strategic visual.
Step 1: Find Your Real Competitors
First things first: who are you actually up against? This is more than just listing the household names in your industry. To get this right, you have to conduct competitive analysis and think like a customer.
You need to identify a few different flavors of competition:
- Direct Competitors: These are the obvious ones. They sell a similar product to a similar audience. Think McDonald's vs. Burger King.
- Indirect Competitors: These guys solve the same core problem but with a completely different solution. A local movie theater isn't just competing with other theaters; it's competing with Netflix.
- Aspirational Competitors: These are the brands your customers wish they could afford or the ones setting the gold standard for experience. They might not be a direct threat, but they shape customer expectations.
Don't just look at the giants. Sometimes your most dangerous competitor is the nimble startup solving the same customer problem in a way no one saw coming.
Step 2: Choose Your Axes Wisely
Now that you know who’s on the field, you need to define the rules of the game. Your two axes are everything. They must be the factors customers genuinely care about when they're pulling out their wallets.
Avoid generic labels like "good" or "bad." Get specific. Are customers weighing price against quality? Ease of use against the number of features? Classic design versus modern innovation?
The trick is to brainstorm a list of potential factors, then validate them with real customer feedback, reviews, or survey data. Pick the two that create the most meaningful contrast and tell the clearest story about your market.
Step 3: Plot Everyone on the Map
Time to put pen to paper (or, more likely, cursor to screen). This is where your research becomes a visual story. Be brutally honest with yourself—this isn't the time for wishful thinking.
Start by placing your competitors on the grid. Based on your research, where do they really sit in the customer's mind?
Then comes the hard part: plot your own brand. You might see yourself as "premium quality," but if customer reviews consistently mention bugs or flimsy materials, you have to plot your brand based on that reality. Map where you are today, not where you hope to be tomorrow.
Step 4: Find Your Unclaimed Territory
Now for the fun part. Step back and look at your completed map. What do you see? You’re hunting for the "blue ocean"—the empty spots on the grid where customer needs exist, but no one is serving them well.
> A crowded quadrant on your map is a red flag. It signals intense competition, price wars, and a constant struggle to be heard. The empty spaces are where the real opportunities are hiding.
Look for clusters. Is everyone dogpiling into the "Low Price, Low Quality" corner? Fantastic. That might mean there's a huge, untapped market for a "High Quality, Medium Price" alternative. The map makes these strategic gaps impossible to ignore.
For a closer look at this kind of competitor mapping, check out our guide on creating a competition matrix analysis.
Step 5: Turn Your Map into a Strategy
A map is useless if it just sits on your desk. The final, most important step is to translate what you’ve learned into a concrete action plan.
Your matrix is now a guide for making tough decisions. Looking at the map, should you:
- Defend your current position and double down on what makes you unique?
- Pivot into one of the open spaces you've identified?
- Create an entirely new product or service to fill a glaring gap?
This isn't a one-and-done task. Your market is always shifting. New competitors arrive, and customer priorities change. Revisit your matrix periodically to see how the landscape has evolved and ensure your strategy is still on point. It’s your compass for navigating the market with confidence, not just guesswork.
Learning from the Positioning Masters
Theory is great, but nothing makes it click like seeing a positioning masterstroke in the wild. Some brands don’t just find an open spot on the map; they redraw the whole thing. Looking at how they pulled it off is like a front-row seat to a strategy masterclass, proving a market positioning matrix isn't just a chart—it's a weapon.
One of the most legendary frameworks for this kind of thinking is the BCG Growth Share Matrix. Back in 1968, the Boston Consulting Group (BCG) rolled out this beautifully simple grid to help companies figure out where to place their bets. It sorts products into four funny-sounding but brilliant categories based on their market share and how fast their market is growing. You can learn more about the iconic growth-share matrix directly from BCG.
A Trip to the BCG Zoo
The BCG matrix essentially organizes your portfolio into a kind of corporate zoo, with each "animal" playing a specific role in the company's ecosystem. Getting to know them is the first step to making much smarter investment decisions.
- Stars (High Growth, High Share): These are your champions. They lead in a booming market, but they're hungry, gobbling up cash to keep growing. The goal? Pour resources into them so they eventually mature into Cash Cows.
- Cash Cows (Low Growth, High Share): Meet your reliable workhorses. They exist in mature, slow-growing markets and don't need much investment. In return, they generate a steady stream of cash you can use to fund your other ventures.
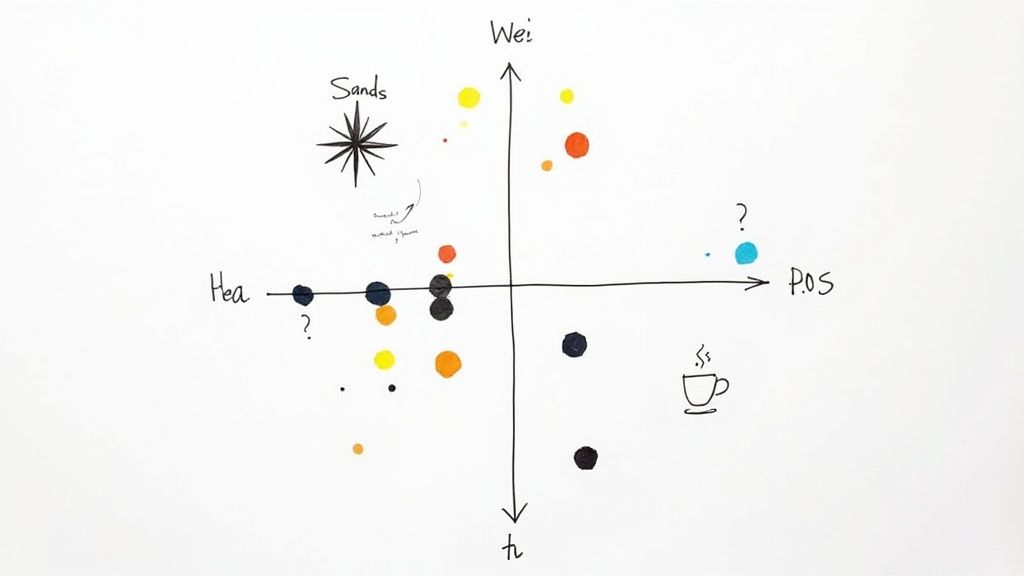
- Question Marks (High Growth, Low Share): These are the wild cards. They're in an exciting, high-growth space but just haven't grabbed a big piece of the pie yet. They need a ton of cash and could either become Stars or just fizzle out. It’s a gamble.
- Dogs (Low Growth, Low Share): And then there are the... well, the dogs. These products are stuck with a weak position in a stagnant market. The typical advice is to divest or phase them out, as they often drain resources without offering much in return.
This matrix forces you to stop looking at your products as standalone items and see them as a connected portfolio. It helps answer the critical question, "Where should our resources go to get the biggest bang for our buck?" It’s a classic for a reason—it uses a simple two-axis grid to bring stunning clarity to really complex business decisions.
How Apple Wiped the Slate Clean
Now, let's look at a more modern example of positioning genius: the iPhone. Before 2007, the smartphone market was a dull, predictable grid. The axes were something like "Business Productivity vs. Consumer Simplicity." BlackBerry was the undisputed king of the business quadrant, while Nokia and Motorola had a stranglehold on the consumer space.
Everyone was just fighting for a better spot on this established map. Then Apple walked in, took that map, and tore it to shreds.
> Apple didn't just find a new position on the old map—it created entirely new axes that made the old map obsolete. Suddenly, the game wasn't about keyboards or flip phones anymore.
The new axes became "App Ecosystem vs. Fixed Functionality." On one end, you had the iPhone with its game-changing App Store, offering limitless potential. On the other, you had every other phone, which could only do what the factory programmed it to do.
This move was a positioning masterstroke. Apple didn't just compete with BlackBerry; it made BlackBerry's main strength (a physical keyboard for emails) feel old-fashioned and restrictive almost overnight. Apple created a brand new quadrant where it was the only player, turning a "red ocean" full of bloody competition into its own private "blue ocean."
This is the real power of a market positioning matrix. It’s not just for figuring out where you fit. It’s for figuring out how to change the game so everyone else has to fit in with you.
Finding Your Golden Opportunity on the Map

Alright, you've put in the work and your market positioning matrix is complete. Now for the fun part—finding the treasure. Think of your finished matrix less like a chart and more like an X-ray of your entire industry. It’s time to play detective and figure out what the map is really telling you.
This visual story instantly shows you where the market is a chaotic mosh pit of competitors, where the quiet, untapped corners are, and—most importantly—how customers actually see you. Be prepared for a wake-up call; your perception of your own brand might not line up with reality.
The insights you find here are the difference between launching a killer strategy and just yelling into the void.
Reading the Tea Leaves: Clusters and Gaps
Your first task is to spot the clusters. These are the overcrowded neighborhoods on your map where a bunch of competitors are all crammed together, fighting over the same patch of grass. If your brand is stuck in one of these clumps, you’re likely facing brutal price wars and a constant struggle for attention.
Now, shift your focus to the wide-open spaces. These are your potential gold mines. But hold on—not every empty quadrant is a viable opportunity. You have to distinguish between a true market gap and a "dead zone."
- A Market Gap: This is an area where a specific customer need exists, but no one is currently serving it well. For example, if your map shows a ton of "High Price, High Quality" options and a bunch of "Low Price, Low Quality" ones, the "High Quality, Medium Price" spot might be a huge opportunity.
- A Dead Zone: This is an empty space where no customers exist because there's simply no demand. An "Extremely Low Quality, Extremely High Price" quadrant is empty for a very good reason—no one wants that.
> The magic happens when you find an empty space on the map that aligns with a real, unmet customer desire. That’s not just a gap; it’s your brand’s next big move.
Turning Your Map into an Action Plan
A finished matrix is a strategic prompt, not a final destination. It should force you to ask some tough questions about your future. This isn't just an academic exercise; it's about turning your visual map into a concrete action plan.
The insights from your map will usually lead you down one of three strategic paths. Your job is to figure out which one makes the most sense for your business right now.
- Double Down and Defend: If your map shows you own a valuable, distinct position with little competition, your job is to fortify it. This means amplifying everything that makes you unique in your marketing and product development.
- Make a Strategic Pivot: Is your current position too crowded or unprofitable? The map will show you the nearest viable empty space. This might mean a slight tweak to your messaging or a more significant shift in your product features to better serve an unmet need.
- Launch a Full-Scale Reinvention: Sometimes the map reveals that your entire market is stale or that a massive opportunity exists far from your current spot. This could inspire a bold move, like launching a new product line or completely overhauling your brand to capture that unclaimed territory.
To figure out which path is right for you, run through this quick checklist while looking at your map.
Your Post-Matrix Action Checklist
- Who are our real neighbors? Are we clustered with the competitors we expected, or are there surprise players nearby?
- Is our current spot profitable? Or is this quadrant a race to the bottom on price?
- Where is the biggest empty space? Does this gap represent a real customer need or a dead zone?
- Can we realistically move? Do we have the resources and brand credibility to claim a new position?
- What one thing could we change to move closer to an open opportunity?
Ultimately, this analysis is a crucial piece of a broader market opportunity assessment, helping you validate your ideas with a clear view of the competitive landscape. Your matrix isn't just a picture; it's a dynamic guide for making smarter, faster, and more confident business decisions.
Common Mistakes That Make Your Matrix Useless
So you’ve built your market positioning matrix. It looks sharp, with an X-axis, a Y-axis, and a smattering of competitor logos. Time for a victory lap, right?
Not so fast. A positioning matrix is a beautifully simple tool, but that’s also what makes it so easy to get wrong. Creating a chart that just confirms your own biases is worse than doing nothing at all—it’s actively pointing your strategy in the wrong direction.
Let’s walk through the common blunders that can turn your shiny new strategic tool into a useless piece of office art.
Choosing Fluffy, Meaningless Axes
This is, without a doubt, the biggest mistake people make. Your axes have to be built on concrete attributes that your customers actually care about when they’re pulling out their wallets. If you pick vague, subjective terms, you’re just mapping out a fantasy.
You need to avoid vanity metrics and corporate buzzwords like the plague. Some classic offenders include:
- "Cool Factor": What does that even mean? "Cool" to a 16-year-old is worlds apart from "cool" to a chief financial officer. It's a completely useless metric.
- "Innovative": Honestly, this word has been beaten into submission. Every company on earth claims to be innovative, so it tells a customer absolutely nothing.
- "Best Quality": This one feels close, but it’s still too broad. Does "quality" mean durability? Lightning-fast speed? Premium materials? You have to get specific.
> Here's a good gut check: If you can't easily explain why a customer would pay more (or less) for a product based on your axis, it's a bad axis. The goal is brutal clarity, not a corporate word salad.
Letting Your Bias Run the Show
It’s just human nature to see your own brand as the hero of the story. Of course, you’re the magical unicorn in the top-right corner—"High Quality, Low Price." The problem is, this matrix isn’t about how you see yourself. It’s about how the customer sees you.
Your internal marketing slogans and personal feelings have no place here. This exercise demands brutal honesty. If the feedback you get is that your prices are too high or your software is buggy, that’s where you belong on the map. This tool is for finding the truth, not for wishful thinking. A map built on ego is a map to nowhere.
Forgetting It's a Living Document
Maybe the most common trap is treating your matrix like a one-and-done project. You build it, present it at a big meeting, everyone nods, and then it gets filed away to gather digital dust. This is a huge mistake.
Your market isn’t a static photograph; it’s a full-length movie. New competitors are constantly popping up, customer tastes evolve, and your rivals will absolutely change their game plan.
A perfect example of this happened back in 2007. When Apple launched the iPhone, it didn't just find a new spot on the smartphone map—it completely redrew the whole thing. Before the iPhone, the axes were pretty set, with BlackBerry dominating business productivity while others fought over consumer simplicity. Apple crashed the party by introducing entirely new axes like "App Ecosystem" and "Intuitive Touchscreen Interface," making the old map obsolete almost overnight. You can find more insights on how market positioning creates new competitive landscapes on already.dev.
Your matrix needs to be a living, breathing document. Pull it out and review it at least once or twice a year. If you don't, you’ll be trying to navigate a 2024 market with a 2022 map, wondering why you keep hitting roadblocks that nobody saw coming.
Frequently Asked Questions
Got a few lingering questions about the market positioning matrix? It's a common feeling. Let's tackle some of the ones we hear most often.
How Often Should I Update My Matrix?
Think of your matrix less like a monument carved in stone and more like a living map. Markets change, new players show up, and customer tastes evolve.
A great rule of thumb is to give it a solid review every 6 to 12 months. You'll also want to pull it out anytime something big happens, like a major new competitor crashing the party. This keeps you from making decisions based on old, irrelevant information.
What If I Can't Find Good Competitor Data?
This is a big one, and the short answer is: don't let perfect be the enemy of good. You'll never have perfect, complete data on your competitors. So, what do you do? Get creative.
Start by digging into customer reviews, social media chatter, and the language they use on their websites. While professional-grade tools like Ahrefs or Semrush are fantastic, they can also be very expensive. For a more accessible option, a tool like already.dev can pull back the curtain and give you those crucial insights without breaking the bank.
Is This Actually Useful for a Small Business?
Yes, 100%. In fact, it might be more important for a small business or a startup.
When you have limited cash and a small team, you can't afford to be wrong about where you fit in the market. A positioning matrix helps you sidestep a head-to-head battle with the giants and find a unique, defensible spot where you can not only compete but actually win. It’s all about being strategic, not just loud.
Ready to stop guessing and find your perfect market position? Already.dev uses AI to do the heavy lifting, delivering deep competitive research in minutes, not weeks. Discover your strategic advantage today.