Share Of Market vs Share Of Voice: A Simple Guide That Won't Put You to Sleep
Confused about share of market vs share of voice? Learn the real difference, how to calculate them, and why one metric predicts your future growth.

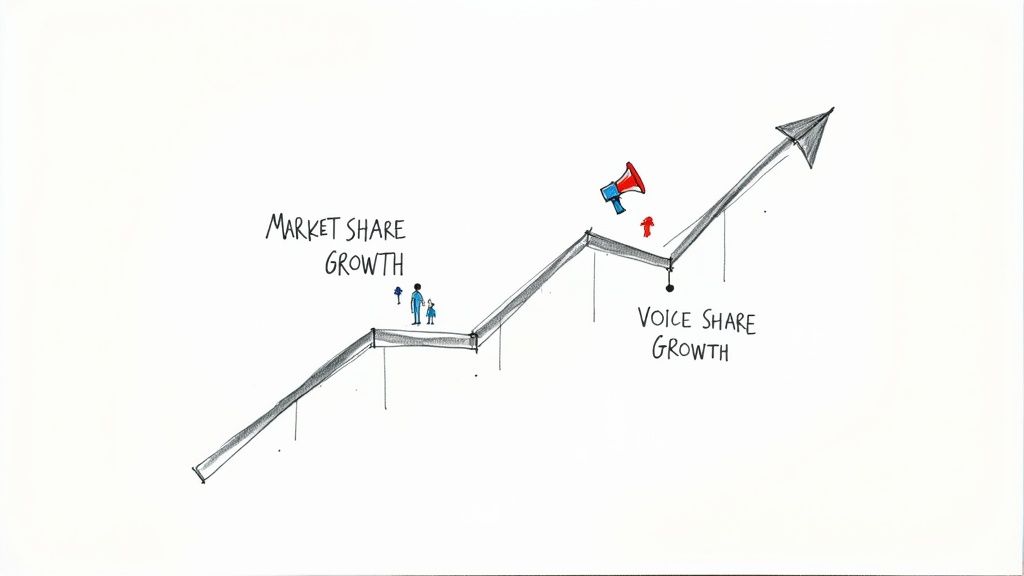
Let's get straight to it. Share of Market (SOM) is the piece of the sales pie you've already eaten. Share of Voice (SOV) is how loud you are yelling about wanting more pie. Think of SOM as a hard number—your sales, right now. SOV is the buzz, the chatter, the "Hey, look at me!" of your brand.
What Are Share Of Market And Share Of Voice Anyway?
Let's cut through the marketing jargon. Imagine you and your competitors are at a pizza party.
-
Share of Market (SOM) is the number of slices you've already crammed into your face. It’s a direct measurement of your sales compared to the total sales of everyone at the party. It's a fact, a done deal. If you ate two out of the eight total slices, your SOM is 25%. Simple.
-
Share of Voice (SOV) is how much you’re dominating the conversation about what pizza to order next time. Are you the one everyone listens to when you shout "Pineapple doesn't belong on pizza!"? That's SOV. It’s your brand awareness, social media chatter, and ad visibility all rolled into one.
So, when you compare share of market vs share of voice, you’re really looking at what you’ve earned versus how much noise you're making. One is about cash in the bank; the other is about being unforgettable.
The Pizza Party Analogy
Let's stick with that pizza party for a moment. SOM is your report card from last semester—it tells you exactly how you performed. SOV is the buzz you're generating in the hallways for next semester's class president election. It’s a powerful clue about your future performance.
A high SOV today can absolutely lead to a higher SOM tomorrow. Why? Because people buy from brands they know and talk about. Shocker, I know.
> A brand's Share of Market tells you its current standing in the sales race. Its Share of Voice predicts its potential to grab a bigger lead in the future. SOM is your reality; SOV is your opportunity.
This distinction is crucial. You could have a respectable share of the market but be completely silent, leaving the door wide open for a noisy competitor to sneak in and steal your customers.
To make this crystal clear, let's break down the core differences.
SOM vs SOV At a Glance
Here’s a simple table to show how these two metrics stack up against each other.
| Metric | What It Measures | What It Tells You | Example | | :--- | :--- | :--- | :--- | | Share of Market (SOM) | Your company's sales as a percentage of total market sales. | Your current commercial success and competitive position. | "Our electric scooter brand sold $10 million in a $100 million market, so we have a 10% SOM." | | Share of Voice (SOV) | Your brand's visibility (mentions, ads, keywords) as a percentage of total industry visibility. | How much of the conversation you own and your potential for future growth. | "Our brand was mentioned 500 times on social media this month, while the industry total was 5,000. We have a 10% SOV." |
As you can see, one is a backward-looking financial metric, and the other is a forward-looking brand metric. Both are essential for understanding where your brand stands and where it's headed.
Why One Metric Looks Back And The Other Looks Ahead
When we get down to the real difference between share of market vs share of voice, I always think of it like driving a car. Your Share of Market (SOM) is the rearview mirror. It gives you a perfect, accurate picture of where you’ve been—last quarter's sales, last year's revenue. It's all facts and figures. Boring, but important.
Your Share of Voice (SOV), on the other hand, is the GPS. It's mapping out the road ahead, warning you about traffic (your competitors' big campaigns), and pointing out open highways (new market opportunities). It’s all about predicting what’s coming.
One tells you about your past. The other helps you shape your future.
SOM Is A Lagging Indicator
Your Share of Market is what we call a lagging indicator. That’s just a fancy way of saying it measures the results of things you've already done. That 10% market share you have? It’s the direct result of past marketing, old product launches, and previous sales pushes.
Think of it as your business report card. It’s absolutely vital for understanding where you currently stand, but it doesn't tell you a thing about where you’re going. A great report card is something to be proud of, but it’s no guarantee you’ll ace the next exam.
SOV Is A Leading Indicator
This is where things get interesting. Share of Voice is a leading indicator. It's basically a forecast—a crystal ball for your brand's future. It’s measuring the chatter and excitement right now that almost always translates into sales down the road.
A high SOV is a powerful signal. It means your brand is grabbing attention, staying top-of-mind, and building the kind of brand recognition that leads to future purchases. This is where growth happens. A brand that consistently makes more noise than its market share would suggest is a brand on the move.
> A brand’s Share of Voice is a direct predictor of its future market share. If you control the conversation today, you are much more likely to control the sales tomorrow. It’s the difference between reporting on history and making it.
The connection is so strong it’s practically a marketing law. If your SOV is higher than your SOM, your market share is likely to grow. If it’s lower, you can probably expect your market share to slip.
The Challenger Brand Scenario
Let's make this tangible. Picture a market dominated by "Big Soda Inc.," a giant with a 40% SOM. They're the undisputed king. But they've gotten lazy and slashed their advertising budget, causing their SOV to fall to just 20%.
Now, enter "Fizzy Fresh," a scrappy startup with only a 2% SOM. They can't possibly outsell Big Soda, but they can definitely out-talk them. They throw their budget into clever social media blitzes and influencer partnerships, getting everyone buzzing. Their SOV explodes to 15%.
What's happening here?
- Big Soda Inc. is heading for a fall. Their rearview mirror (high SOM) looks fantastic, but their GPS (low SOV) is screaming with red alerts. They're losing the conversation, and soon they'll start losing customers.
- Fizzy Fresh is the one to watch. They might be small now, but their massive SOV is a huge leading indicator of future growth. They are building the brand awareness that will eventually chip away at the sleeping giant's market share.
This dynamic is everything. Quantifying Share of Voice allows you to see the brand momentum that Share of Market completely ignores. You can find more great insights on how these metrics work together on talkwalker.com.
Ultimately, you’re not choosing one over the other. You need both the rearview mirror and the GPS to drive your business forward.
How to Calculate These Metrics Without a PhD
Alright, let's get down to the numbers. I promise this won't feel like your high school algebra class. The formulas for both Share of Market (SOM) and Share of Voice (SOV) are surprisingly simple.
The real trick isn't the math itself—it's getting your hands on the right numbers to plug in.
Nailing Down Your Share of Market Formula
Calculating your Share of Market is the more straightforward of the two. At its core, it’s all about sales data, which hopefully you’ve got a good handle on.
Here’s the formula:
> (Your Company's Total Sales / Total Market Sales) x 100 = Your SOM (%)
Let's say you sell $2 million worth of organic dog food in a year, and the entire market for that specific niche is worth $20 million. A little quick math shows you’ve got a 10% Share of Market. Boom, done.
The real challenge? Finding that "Total Market Sales" number. It can be a pain. Here are a few places I always look:
- Industry Reports: Firms like Gartner or Forrester publish these, but be warned, they can be super expensive.
- Government Data: You can often find solid estimates in publicly available economic data.
- Competitor Filings: If your competitors are public companies, their annual reports are an absolute goldmine of information.
SOM is your "show me the money" metric. It’s grounded in actual revenue, which makes it a rock-solid benchmark for your current performance. Now for the fun part.
Decoding The Share of Voice Formula
Share of Voice is a bit more slippery because "voice" can mean so many different things. It’s all about owning the conversation, and that conversation is happening all over the place.
The basic formula, though, is just as simple:
> (Your Brand Mentions / Total Industry Mentions) x 100 = Your SOV (%)
The key is defining what "mentions" actually means for your business. It could be anything from your brand’s hashtag usage on Instagram to your keyword rankings on Google. You can—and should—calculate SOV for different channels to see where you're really winning. If you want to get into the nitty-gritty, we have a whole guide on how to calculate Share of Voice.
Here are the key battlegrounds for modern SOV:
-
SEO Visibility: This is all about your share of clicks for important keywords. If you show up for 300 of the 1,000 monthly searches for "vegan protein powder," your organic SOV for that term is 30%.
-
Social Media Chatter: This includes direct @mentions, hashtag usage, and even untagged conversations about your brand versus your competitors.
-
Pay-Per-Click (PPC) Dominance: Think of this as your ad impression share on platforms like Google Ads. It literally tells you what percentage of the available ad space you're capturing.
-
Media and PR Mentions: How often are news sites, blogs, and podcasts talking about you compared to the other players in your field?
Trying to track all of this manually is a nightmare. This is where the right tools become your best friend. Sure, big platforms like Ahrefs or Semrush are incredibly powerful for SEO and PPC data, but let's be honest, they can be ridiculously expensive. For a more focused and accessible alternative, a tool like already.dev can help you track your digital footprint and see where you stand without that hefty price tag.
The Magic Number That Predicts Your Growth
Okay, so we've established that Share of Voice (SOV) is like a crystal ball. But how do you actually turn that into a number you can act on? This is where the concept of Excess Share of Voice (ESOV) comes in.
This is the secret sauce. It’s the number that connects the dots between how much people are talking about you today and how much they’ll be buying from you tomorrow. Put simply, ESOV is what happens when your Share of Voice outpaces your Share of Market.
Let's say your Share of Market (SOM) is 10%, but your Share of Voice (SOV) is a solid 15%. That gives you an ESOV of +5 points. You’re punching above your weight class, making more noise than your current size suggests. This isn’t just a feel-good metric; it’s a powerful engine for growth.
Shouting Louder Than Your Size
The old idea that you can talk your way to the top isn't just wishful thinking—it's actually backed by some pretty solid research. A landmark study found a clear, quantifiable link between a brand's ESOV and its future market share. The big takeaway? For every 10% increase in ESOV, a brand typically saw a 0.5% bump in market share. If you want to get into the weeds, you can read about the original research findings on nielsen.com.
This gives us a fantastic rule of thumb for planning marketing budgets and setting growth targets.
> The formula is surprisingly simple. If you want to grow, your share of voice has to be greater than your share of market. If you’re happy holding steady, aim for your SOV to roughly match your SOM.
This principle is the cornerstone of smart budget planning. It helps you frame your marketing spend as a direct investment in future revenue, not just another line item on the expense sheet. For a closer look at this kind of thinking, check out our guide on how to approach market research data analysis.
This image breaks down how Share of Market and Share of Voice stack up for three different brands.
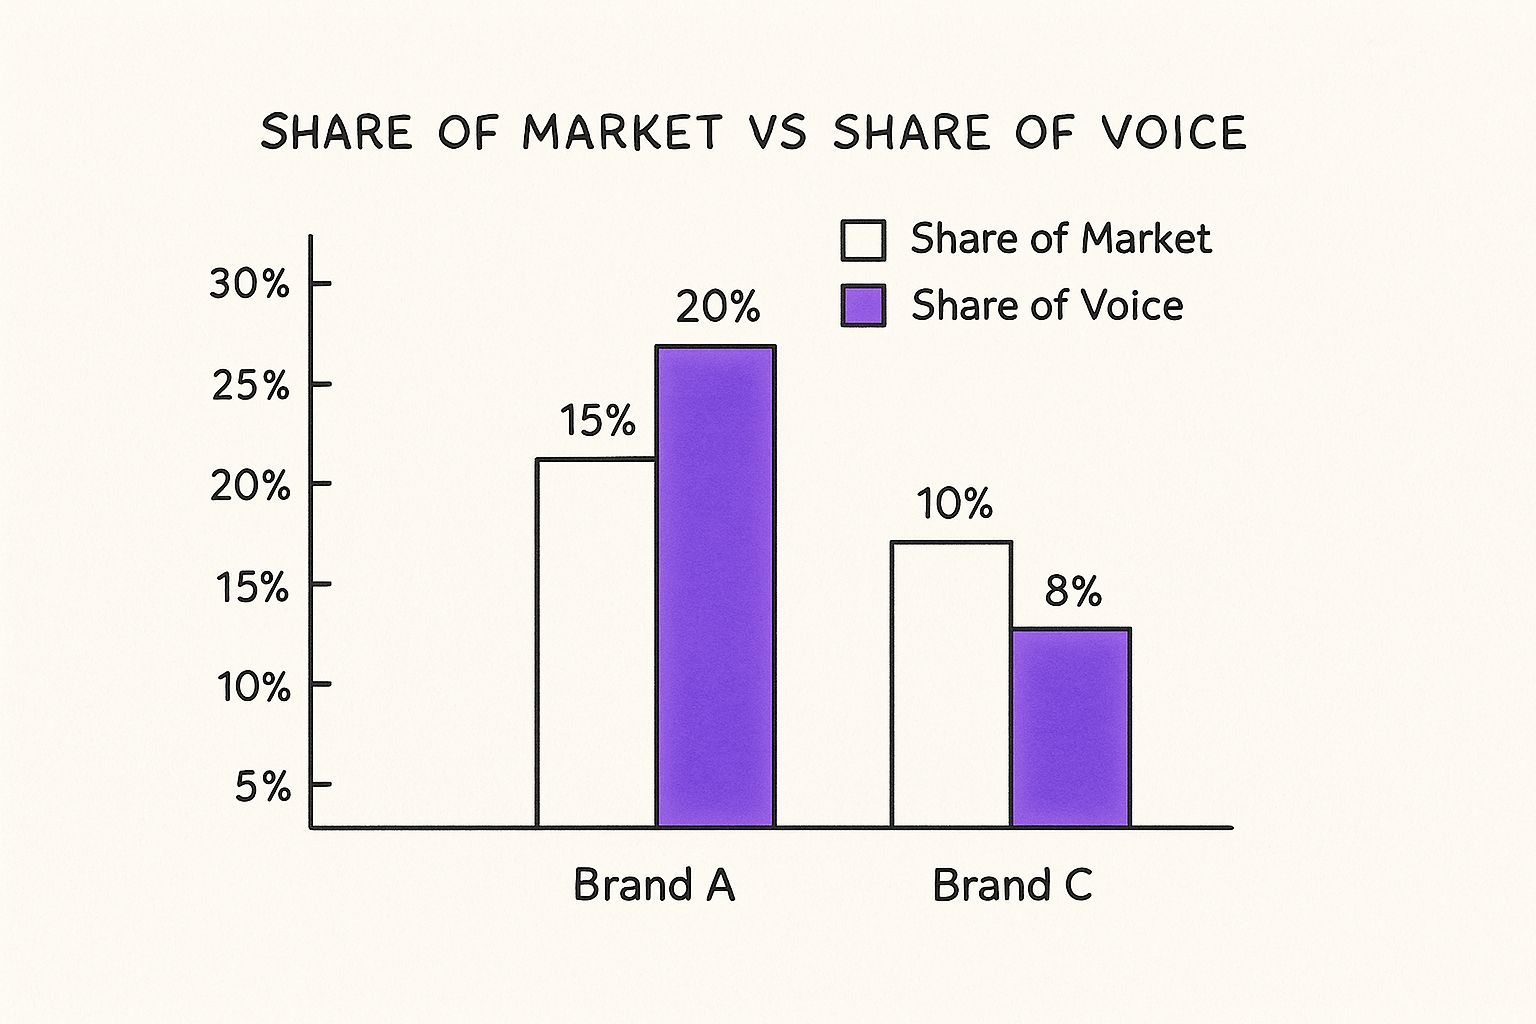
As you can see, Brand A and Brand B both have a positive ESOV, which puts them in a great position to grow. Brand C, on the other hand, has a lower SOV and is at risk of losing ground.
A Challenger Brand's Playbook
Let's look at a real-world example. Picture a crowded energy drink market, with two giants owning a combined 60% of it. A new brand, let's call them "Zap Energy," jumps in with a tiny 2% market share.
Trying to compete on price or distribution would be a losing battle. So, they go all-in on an aggressive ESOV strategy. They pour their budget into sponsoring niche e-sports tournaments, creating viral TikToks, and teaming up with edgy influencers.
A year later, their SOV has shot up to 12%. That gives them an ESOV of +10 points. Based on that rule of thumb, this should translate to about a 0.5% gain in market share. And what do you know? By the next fiscal year, their SOM has climbed to 2.5%—a 25% jump for their business.
This is exactly how challengers shake up a market. They don't have the sales to justify a massive voice, so they build a massive voice to create future sales.
How to Balance Your Budget for Maximum Impact
Alright, so you get the idea. Share of Market (SOM) is the piece of the pie you have right now, and Share of Voice (SOV) is how loud you're being to get a bigger slice. But how do you actually use this to decide where your marketing dollars go without just, you know, setting cash on fire?
This is where things get interesting. We need to talk about the "equilibrium threshold." It sounds super technical, but all it means is the point where your SOV is the same as your SOM. If you have a 10% market share and your share of voice is also 10%, you’ve hit equilibrium. Pat yourself on the back—you're spending just enough to stay afloat.
But who’s really satisfied with just treading water?
Finding Your Budgeting Sweet Spot
Your budget should mirror your ambition. Are you playing defense and just trying to hold your ground? Or are you on offense, trying to take over the market?
> Think of your marketing budget as a growth lever. If you spend just enough to match your market share, you’ll probably stay right where you are. To grow, you have to pull that lever harder by investing in a voice that’s bigger than your current sales figures.
This isn't just a hunch; it's backed by a ton of data. The connection between SOV and SOM is a core concept in marketing analytics. Research from places like the Institute for Marketing Science shows that a brand's growth is almost always tied to keeping its SOV above that equilibrium point. You can dive deeper into the analytics behind market share growth on im-sciences.com.
Setting a Budget Based on Your Goals
So, how do you translate this into an actual budget? It really boils down to checking out the competition and setting some clear goals for yourself.
Here’s a practical way to approach it:
-
Maintain Your Position (Equilibrium): If your only goal is to hold on to your current market share, then your SOV should be about the same as your SOM. You'll need to see what your competitors are spending to maintain their voice and aim to match that, relative to your size. This is your baseline, your defensive spending.
-
Grow Your Market Share (ESOV): Ready to grow? Then you need what’s called Excess Share of Voice (ESOV). This just means your SOV has to be higher than your SOM. For example, if your SOM is currently 5%, you might aim for a 10% SOV to start making some real headway. This is your investment in future sales.
-
Risking Decline (Underinvestment): If you slash your budget and let your SOV drop below your SOM, you’re sending a dangerous signal to the market. You’re essentially telling everyone you’re becoming less relevant, and believe me, your competitors will be more than happy to fill the silence you've left behind.
To figure out how much a 10% SOV actually costs, you’re going to have to do a little snooping. Tools like Ahrefs or Semrush can give you a peek into your competitors' ad spend and keyword visibility, but they're not cheap. For a more accessible option, already.dev can help you track your digital presence and see how you stack up without draining your bank account.
Doing this kind of analysis before you start spending is a non-negotiable step. It’s a huge part of figuring out if you have a product that can actually compete. For more on that, check out our guide to validating your product-market fit.
Your Top Questions Answered
We've covered a ton of ground on share of market vs. share of voice, from formulas to pizza analogies. Now, let’s get into the questions that are probably buzzing in your head. This is the rapid-fire round.
Is A High Share Of Voice Always A Good Thing?
Mostly, yes, but it’s not that black and white. A high Share of Voice means you’re on people’s minds, which is fantastic fuel for growth. The real million-dollar question, though, is why they're talking about you. If you’re dominating the conversation because your new product is a runaway hit, you’re golden.
But if your SOV spikes because of a PR nightmare or a huge scandal, that's a five-alarm fire. You're the talk of the town for all the wrong reasons. This is why you can never just look at the volume; you have to dig into the sentiment behind all that chatter.
> A high Share of Voice paired with overwhelmingly positive sentiment is the holy grail. Think of SOV as potential energy; you still have to convert it into actual sales.
How Often Should I Measure These Metrics?
This is a great question because these two metrics operate on completely different clocks.
Share of Market (SOM) is the slow-moving giant. It’s built on hard sales data, which takes time to gather. For most businesses, checking your SOM quarterly is the right cadence. It gives you a solid, big-picture view.
Share of Voice (SOV), on the other hand, can turn on a dime. A competitor's viral video can completely reshape the conversation overnight. You should be keeping an eye on your digital SOV weekly, or even daily if you’re in a particularly fast-moving industry.
Bottom line: track SOM quarterly to steer the ship, but monitor SOV weekly to navigate the daily waves.
Can A Small Business Compete On Share Of Voice?
Absolutely. In fact, this is where a small, nimble business can run circles around the big, slow-moving corporations. It’s the classic David vs. Goliath story, and Share of Voice is David’s slingshot.
Look, you're never going to outspend a massive competitor on a broad scale. But you can be much, much smarter. Instead of trying to win the conversation for a huge topic like "shoes," you can completely own the conversation for a specific niche like "sustainable vegan hiking boots for women."
Here’s how you win:
- Go Niche: Target a super-specific audience and become their go-to expert.
- Be Clever: Create content that’s so funny, useful, or interesting that people can’t help but share it.
- Build Community: Jump into the trenches. Engage directly with your audience on social media and forums. Answer their questions. Be a real person.
By being the loudest, most helpful voice in the small pond that matters most, you can build a fiercely loyal following that the big guys can only dream of.
My SOV Is High But My Sales Aren't Growing. What's Wrong?
Ah, the classic "marketing-sales gap." This is one of the most frustrating problems a business can face. A high Share of Voice proves your marketing is working—it's grabbing attention and bringing people to your door. If they aren’t buying, the problem isn’t your marketing; it’s what happens after the marketing.
Think of it like a leaky bucket. Your SOV is filling the bucket with potential customers, but there's a hole somewhere.
Start asking these questions:
- Is it a Distribution Issue? People are hearing about you but can't find your product in stores or online.
- Is it a Product or UX Issue? They get to your website, but it’s confusing, slow, or your prices are wildly off-base.
- Is it a Targeting Issue? Your ads are reaching a huge audience, but it's the wrong audience—people who love your brand but will never actually buy your product.
Your high SOV isn't the problem; it's a powerful diagnostic tool. It tells you the brand message is landing. Now you just need to follow the customer journey and pinpoint where they're getting stuck.
Navigating the delicate dance between share of market and share of voice requires sharp insights and real-time data. Instead of guessing where you stand, let already.dev give you the competitive intelligence you need to make smarter, faster decisions. See exactly where you and your competitors rank in the conversation and turn that knowledge into a winning strategy.